Dell 2011 Annual Report Download - page 73
Download and view the complete annual report
Please find page 73 of the 2011 Dell annual report below. You can navigate through the pages in the report by either clicking on the pages listed below, or by using the keyword search tool below to find specific information within the annual report.-
 1
1 -
2
-
3
-
4
-
5
-
6
-
7
-
8
-
9
-
10
-
11
-
12
-
13
-
14
-
15
-
16
-
17
-
18
-
19
-
20
-
21
-
22
-
23
-
24
-
25
-
26
-
27
-
28
-
29
-
30
-
31
-
32
-
33
-
34
-
35
-
36
-
37
-
38
-
39
-
40
-
41
-
42
-
43
-
44
-
45
-
46
-
47
-
48
-
49
-
50
-
51
-
52
-
53
-
54
-
55
-
56
-
57
-
58
-
59
-
60
-
61
-
62
-
 63
63 -
 64
64 -
 65
65 -
 66
66 -
 67
67 -
 68
68 -
 69
69 -
 70
70 -
 71
71 -
 72
72 -
 73
73 -
 74
74 -
 75
75 -
 76
76 -
 77
77 -
 78
78 -
 79
79 -
 80
80 -
 81
81 -
 82
82 -
 83
83 -
84
-
85
-
86
-
87
-
88
-
89
-
90
-
91
-
92
-
93
-
94
-
95
-
96
-
97
-
98
-
99
-
100
-
101
-
102
-
103
-
104
-
105
-
106
-
107
-
108
-
109
-
110
-
111
-
112
-
113
-
114
-
115
-
116
-
117
-
118
-
119
-
120
-
121
-
122
-
123
-
124
-
125
-
126
-
127
-
128
-
129
-
130
-
131
-
132
-
133
-
134
-
135
-
136
-
137
 |
 |
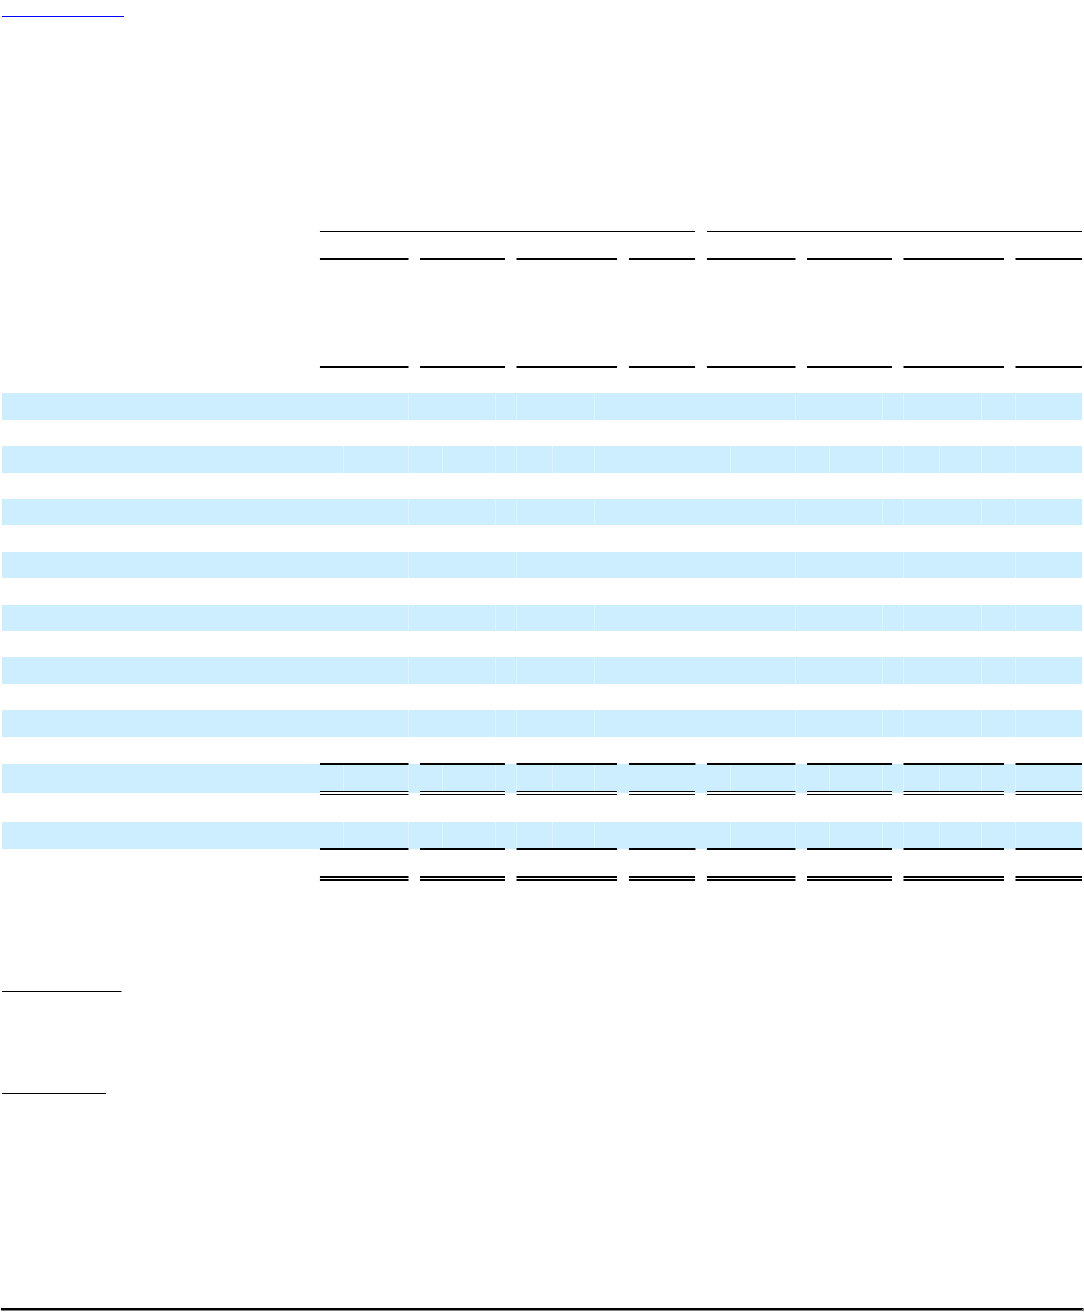
Table of Contents DELL INC.
NOTES TO CONSOLIDATED FINANCIAL STATEMENTS (Continued)
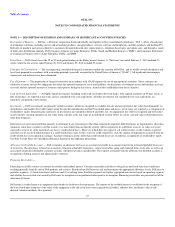
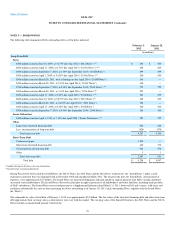
NOTE 2 — FAIR VALUE MEASUREMENTS
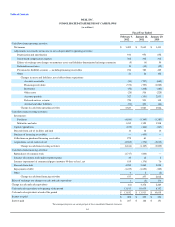
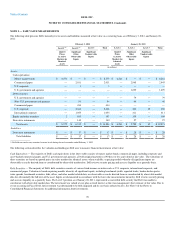
The following table presents Dell's hierarchy for its assets and liabilities measured at fair value on a recurring basis as of February 3, 2012, and January 28,
2011:
February 3, 2012 January 28, 2011
Level 1 (a) Level 2 (a) Level 3 Total Level 1 Level 2 Level 3 Total
Quoted
Prices
in Active
Markets for
Identical
Assets
Significant
Other
Observable
Inputs
Significant
Unobservable
Inputs
Quoted
Prices
in Active
Markets for
Identical
Assets
Significant
Other
Observable
Inputs
Significant
Unobservable
Inputs
(in millions)
Assets:
Cash equivalents:
Money market funds $ 8,370 $ — $ — $ 8,370 $ 6,261 $ — $ — $ 6,261
Commercial paper — 2,011 — 2,011 — 2,945 — 2,945
U.S. corporate — 5 — 5 — — — —
U.S. government and agencies — — — — — 1,699 — 1,699
Debt securities:
U.S. government and agencies — — — — — 79 — 79
Non- U.S. government and agencies — 94 — 94 — 46 — 46
Commercial paper — 434 — 434 — — — —
U.S. corporate — 2,668 — 2,668 — 464 32 496
International corporate — 1,055 — 1,055 — 411 — 411
Equity and other securities 2 105 — 107 — 109 — 109
Derivative instruments — 140 — 140 — 27 — 27
Total assets $ 8,372 $ 6,512 $ — $ 14,884 $ 6,261 $ 5,780 $ 32 $ 12,073
Liabilities:
Derivative instruments $ — $ 17 $ — $ 17 $ — $ 28 $ — $ 28
Total liabilities $ — $ 17 $ — $ 17 $ — $ 28 $ — $ 28
____________________
(a) Dell did not transfer any securities between levels during the twelve months ended February 3, 2012.
The following section describes the valuation methodologies Dell uses to measure financial instruments at fair value:
Cash Equivalents — The majority of Dell's cash equivalents in the above table consists of money market funds, commercial paper, including corporate and
asset-backed commercial paper, and U.S. government and agencies, all with original maturities of 90 days or less and valued at fair value. The valuations of
these securities are based on quoted prices in active markets for identical assets, when available, or pricing models whereby all significant inputs are
observable or can be derived from or corroborated by observable market data. Dell reviews security pricing and assesses liquidity on a quarterly basis.
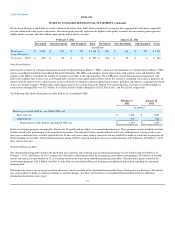
Debt Securities — The majority of Dell's debt securities consists of various fixed income securities such as U.S. corporate, international corporate, and
commercial paper. Valuation is based on pricing models whereby all significant inputs, including benchmark yields, reported trades, broker-dealer quotes,
issue spreads, benchmark securities, bids, offers, and other market related data, are observable or can be derived from or corroborated by observable market
data for substantially the full term of the asset. Inputs are documented in accordance with the fair value measurements hierarchy. Dell reviews security pricing
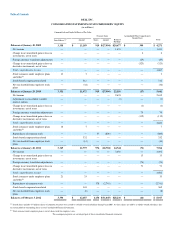
and assesses liquidity on a quarterly basis. The Level 3 position as of January 28, 2011, represented a convertible debt security that Dell was unable to
corroborate with observable market data. The investment was valued at cost plus accrued interest as this was management's best estimate of fair value. Due to
events occurring in Fiscal 2012, the investment was determined to be fully impaired and its cost basis reduced to zero. See Note 3 of the Notes to
Consolidated Financial Statements for additional information about investments.
70