Dell 2011 Annual Report Download - page 45
Download and view the complete annual report
Please find page 45 of the 2011 Dell annual report below. You can navigate through the pages in the report by either clicking on the pages listed below, or by using the keyword search tool below to find specific information within the annual report.-
 1
1 -
2
-
3
-
4
-
5
-
6
-
7
-
8
-
9
-
10
-
11
-
12
-
13
-
14
-
15
-
16
-
17
-
18
-
19
-
20
-
21
-
22
-
23
-
24
-
25
-
26
-
27
-
28
-
29
-
30
-
31
-
32
-
33
-
34
-
 35
35 -
 36
36 -
 37
37 -
 38
38 -
 39
39 -
 40
40 -
 41
41 -
 42
42 -
 43
43 -
 44
44 -
 45
45 -
 46
46 -
 47
47 -
 48
48 -
 49
49 -
 50
50 -
 51
51 -
 52
52 -
 53
53 -
 54
54 -
 55
55 -
56
-
57
-
58
-
59
-
60
-
61
-
62
-
63
-
64
-
65
-
66
-
67
-
68
-
69
-
70
-
71
-
72
-
73
-
74
-
75
-
76
-
77
-
78
-
79
-
80
-
81
-
82
-
83
-
84
-
85
-
86
-
87
-
88
-
89
-
90
-
91
-
92
-
93
-
94
-
95
-
96
-
97
-
98
-
99
-
100
-
101
-
102
-
103
-
104
-
105
-
106
-
107
-
108
-
109
-
110
-
111
-
112
-
113
-
114
-
115
-
116
-
117
-
118
-
119
-
120
-
121
-
122
-
123
-
124
-
125
-
126
-
127
-
128
-
129
-
130
-
131
-
132
-
133
-
134
-
135
-
136
-
137
 |
 |

Table of Contents
backlog as of January 28, 2011, and January 29, 2010, was $13.9 billion and $12.8 billion, respectively. Deferred revenue from extended warranties was $6.4
billion and $5.9 billion as of January 28, 2011, and January 29, 2010, respectively. Estimated contracted services backlog, which is primarily related to our
outsourcing services business, was $7.5 billion and $6.9 billion, as of January 28, 2011, and January 29, 2010, respectively.
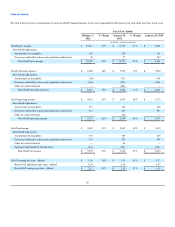
•Software and Peripherals — The 8% increase in S&P revenue for Fiscal 2011 was driven by overall customer unit shipment increases due to sales of
displays and electronics and peripherals, which experienced a combined year-over-year revenue increase of 15% for Fiscal 2011, while revenue from
imaging products decreased by 6%.
Software and related support services revenue represented 33% and 39% of services revenue, including software related, for Fiscal 2011 and Fiscal 2010,
respectively.
•Client
▪Mobility — Revenue from mobility products increased 14% during Fiscal 2011 across all operating segments due to demand improvements.
Notebook units increased 14%, while average selling prices remained flat during Fiscal 2011. During Fiscal 2011, overall Commercial mobility
revenue increased 19% year-over-year, while revenue from Consumer mobility increased 8%. The increase in Commercial mobility was driven by
increases in demand for our Latitude notebooks.
▪Desktop PCs — During Fiscal 2011, revenue from desktop PCs increased as unit demand for desktop PCs increased by 10%. The average selling
price for our desktop computers increased by 3% year-over-year due to a slight shift in product mix to higher priced units. The increase in unit
demand was driven by our Large Enterprise and SMB customers, generating increases of 25% and 23%, year-over-year, respectively, for Fiscal
2011. These increases were driven primarily by the stronger demand for our Optiplex desktop PCs and fixed work stations.
Stock-Based Compensation
We primarily use our 2002 Long-Term Incentive Plan, amended in December 2007, for stock-based incentive awards. These awards can be in the form of
stock options, stock appreciation rights, stock bonuses, restricted stock, restricted stock units, performance units, or performance shares. Stock-based
compensation expense totaled $362 million for Fiscal 2012, compared to $332 million and $312 million for Fiscal 2011 and Fiscal 2010, respectively. For
further discussion on stock-based compensation, see Note 14 of Notes to Consolidated Financial Statements included in “Part II — Item 8 — Financial
Statements and Supplementary Data.”
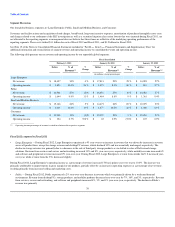
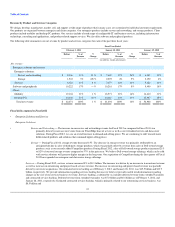
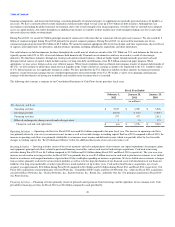
Interest and Other, net
The following table provides a detailed presentation of Interest and other, net for each of the past three fiscal years:
Fiscal Year Ended
February 3,
2012 January 28,
2011 January 29,
2010
(in millions)
Interest and other, net:
Investment income, primarily interest $ 81 $ 47 $ 57
Gains (losses) on investments, net 8 6 2
Interest expense (279) (199) (160)
Foreign exchange 5 4 (59)
Other (6) 59 12
Interest and other, net $ (191) $ (83) $ (148)
Fiscal 2012 compared to Fiscal 2011
Our investment income increased in Fiscal 2012 over the prior year primarily due to higher average cash and investment balances as well as a shift to longer-
duration investments, which have higher investment yields. Overall investment yield in Fiscal 2012 increased from approximately 35 basis points during
Fiscal 2011 to approximately 49 basis points.
The year-over-year increase in interest expense for Fiscal 2012 was due to higher debt levels, which increased to $9.3 billion as
43