Dell 2011 Annual Report Download - page 30
Download and view the complete annual report
Please find page 30 of the 2011 Dell annual report below. You can navigate through the pages in the report by either clicking on the pages listed below, or by using the keyword search tool below to find specific information within the annual report.-
 1
1 -
2
-
3
-
4
-
5
-
6
-
7
-
8
-
9
-
10
-
11
-
12
-
13
-
14
-
15
-
16
-
17
-
18
-
19
-
 20
20 -
 21
21 -
 22
22 -
 23
23 -
 24
24 -
 25
25 -
 26
26 -
 27
27 -
 28
28 -
 29
29 -
 30
30 -
 31
31 -
 32
32 -
 33
33 -
 34
34 -
 35
35 -
 36
36 -
 37
37 -
 38
38 -
 39
39 -
 40
40 -
41
-
42
-
43
-
44
-
45
-
46
-
47
-
48
-
49
-
50
-
51
-
52
-
53
-
54
-
55
-
56
-
57
-
58
-
59
-
60
-
61
-
62
-
63
-
64
-
65
-
66
-
67
-
68
-
69
-
70
-
71
-
72
-
73
-
74
-
75
-
76
-
77
-
78
-
79
-
80
-
81
-
82
-
83
-
84
-
85
-
86
-
87
-
88
-
89
-
90
-
91
-
92
-
93
-
94
-
95
-
96
-
97
-
98
-
99
-
100
-
101
-
102
-
103
-
104
-
105
-
106
-
107
-
108
-
109
-
110
-
111
-
112
-
113
-
114
-
115
-
116
-
117
-
118
-
119
-
120
-
121
-
122
-
123
-
124
-
125
-
126
-
127
-
128
-
129
-
130
-
131
-
132
-
133
-
134
-
135
-
136
-
137
 |
 |

Table of Contents
RESULTS OF OPERATIONS
Consolidated Operations
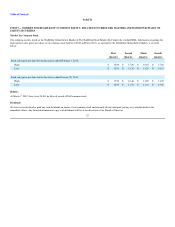
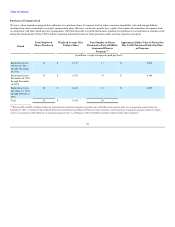
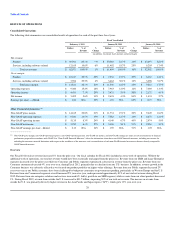
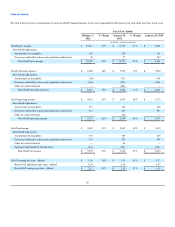
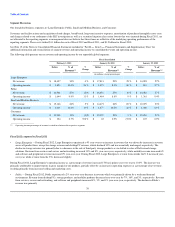
The following table summarizes our consolidated results of operations for each of the past three fiscal years:
Fiscal Year Ended
February 3, 2012 January 28, 2011 January 29, 2010
Dollars % of
Revenue %
Change Dollars % of
Revenue %
Change Dollars % of
Revenue
(in millions, except per share amounts and percentages)
Net revenue:
Product $ 49,906 80.4% —% $ 50,002 81.3% 14% $ 43,697 82.6%
Services, including software related 12,165 19.6% 6% 11,492 18.7% 25% 9,205 17.4%
Total net revenue $ 62,071 100.0% 1% $ 61,494 100.0% 16% $ 52,902 100.0%
Gross margin:
Product $ 10,217 20.5% 29% $ 7,934 15.9% 29% $ 6,163 14.1%
Services, including software related 3,594 29.5% 4% 3,462 30.1% 12% 3,098 33.7%
Total gross margin $ 13,811 22.3% 21% $ 11,396 18.5% 23% $ 9,261 17.5%
Operating expenses $ 9,380 15.2% 18% $ 7,963 12.9% 12% $ 7,089 13.4%
Operating income $ 4,431 7.1% 29% $ 3,433 5.6% 58% $ 2,172 4.1%
Net income $ 3,492 5.6% 33% $ 2,635 4.3% 84% $ 1,433 2.7%
Earnings per share — diluted $ 1.88 N/A 39% $ 1.35 N/A 85% $ 0.73 N/A
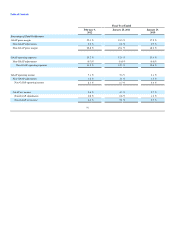
Other Financial Information (a)
Non-GAAP gross margin $ 14,165 22.8% 21% $ 11,731 19.1% 22% $ 9,649 18.2%
Non-GAAP operating expenses $ 9,030 14.5% 19% $ 7,582 12.3% 14% $ 6,675 12.6%
Non-GAAP operating income $ 5,135 8.3% 24% $ 4,149 6.7% 40% $ 2,974 5.6%
Non-GAAP net income $ 3,952 6.4% 27% $ 3,106 5.1% 51% $ 2,054 3.9%
Non-GAAP earnings per share - diluted $ 2.13 N/A 34% $ 1.59 N/A 51% $ 1.05 N/A
_____________________
(a) Non-GAAP gross margin, non-GAAP operating expenses, non-GAAP operating income, non-GAAP net income, and non-GAAP earnings per share are not measurements of financial
performance prepared in accordance with GAAP. See “Non-GAAP Financial Measures” below for information about these non-GAAP financial measures, including our reasons for
including the measures, material limitations with respect to the usefulness of the measures, and a reconciliation of each non-GAAP financial measure to the most directly comparable
GAAP financial measure.
Overview
Our Fiscal 2012 total net revenue increased 1% from the prior year. Our fiscal calendar for Fiscal 2012 included an extra week of operations. Without the
additional week of operations, our total net revenue would have been essentially unchanged from the prior year. Revenue from our SMB and Large Enterprise
segments increased over the prior year while our Consumer and Public segments experienced a decrease in revenue from the prior year. Revenue from our
Consumer customers decreased 4%, year-over-year, during Fiscal 2012, primarily due to a decline from our U.S. business. In addition, revenue growth in the
Consumer business was adversely affected as we focused our product portfolio on higher-value offerings. Revenue from our Public segment decreased 2%
year-over-year as our Public customers have been challenged by budgetary constraints on government spending, particularly in Western Europe and the U.S.
Revenue from our Commercial segments overall increased 2% year-over-year, and represented approximately 81% of our total net revenue during Fiscal
2012. Revenue from our enterprise solutions and services increased 6%, led by growth in our SMB segment, while revenue from our client products decreased
1%. During Fiscal 2012, revenue from outside the U.S. increased to $31.7 billion, surpassing 50% of our total net revenue. The increase in revenue from
outside the U.S. was primarily driven by higher revenue in the Asia Pacific and Japan region ("APJ"), which grew 13% year-over-year.
28