Dell 2011 Annual Report Download - page 106
Download and view the complete annual report
Please find page 106 of the 2011 Dell annual report below. You can navigate through the pages in the report by either clicking on the pages listed below, or by using the keyword search tool below to find specific information within the annual report.-
 1
1 -
2
-
3
-
4
-
5
-
6
-
7
-
8
-
9
-
10
-
11
-
12
-
13
-
14
-
15
-
16
-
17
-
18
-
19
-
20
-
21
-
22
-
23
-
24
-
25
-
26
-
27
-
28
-
29
-
30
-
31
-
32
-
33
-
34
-
35
-
36
-
37
-
38
-
39
-
40
-
41
-
42
-
43
-
44
-
45
-
46
-
47
-
48
-
49
-
50
-
51
-
52
-
53
-
54
-
55
-
56
-
57
-
58
-
59
-
60
-
61
-
62
-
63
-
64
-
65
-
66
-
67
-
68
-
69
-
70
-
71
-
72
-
73
-
74
-
75
-
76
-
77
-
78
-
79
-
80
-
81
-
82
-
83
-
84
-
85
-
86
-
87
-
88
-
89
-
90
-
91
-
92
-
93
-
94
-
95
-
 96
96 -
 97
97 -
 98
98 -
 99
99 -
 100
100 -
 101
101 -
 102
102 -
 103
103 -
 104
104 -
 105
105 -
 106
106 -
 107
107 -
 108
108 -
 109
109 -
 110
110 -
 111
111 -
 112
112 -
 113
113 -
 114
114 -
 115
115 -
 116
116 -
117
-
118
-
119
-
120
-
121
-
122
-
123
-
124
-
125
-
126
-
127
-
128
-
129
-
130
-
131
-
132
-
133
-
134
-
135
-
136
-
137
 |
 |

Table of Contents DELL INC.
NOTES TO CONSOLIDATED FINANCIAL STATEMENTS (Continued)
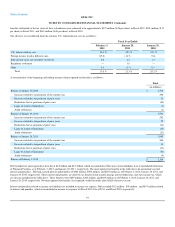
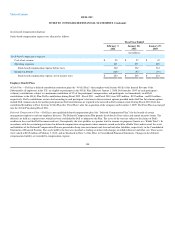
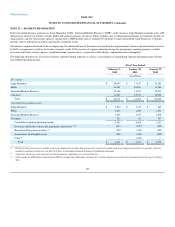
The following table presents net revenue by product and services categories:
Fiscal Year Ended
February 3,
2012 January 28,
2011 January 29,
2010
(in millions)
Net revenue:
Enterprise Solutions and Services:
Enterprise Solutions:
Servers and networking $ 8,336 $ 7,609 $ 6,032
Storage 1,943 2,295 2,192
Services 8,322 7,673 5,622
Software and peripherals 10,222 10,261 9,499
Client:
Mobility 19,104 18,971 16,610
Desktop PCs 14,144 14,685 12,947
Net revenue $ 62,071 $ 61,494 $ 52,902
103