Dell 2011 Annual Report Download - page 52
Download and view the complete annual report
Please find page 52 of the 2011 Dell annual report below. You can navigate through the pages in the report by either clicking on the pages listed below, or by using the keyword search tool below to find specific information within the annual report.-
 1
1 -
2
-
3
-
4
-
5
-
6
-
7
-
8
-
9
-
10
-
11
-
12
-
13
-
14
-
15
-
16
-
17
-
18
-
19
-
20
-
21
-
22
-
23
-
24
-
25
-
26
-
27
-
28
-
29
-
30
-
31
-
32
-
33
-
34
-
35
-
36
-
37
-
38
-
39
-
40
-
41
-
 42
42 -
 43
43 -
 44
44 -
 45
45 -
 46
46 -
 47
47 -
 48
48 -
 49
49 -
 50
50 -
 51
51 -
 52
52 -
 53
53 -
 54
54 -
 55
55 -
 56
56 -
 57
57 -
 58
58 -
 59
59 -
 60
60 -
 61
61 -
 62
62 -
63
-
64
-
65
-
66
-
67
-
68
-
69
-
70
-
71
-
72
-
73
-
74
-
75
-
76
-
77
-
78
-
79
-
80
-
81
-
82
-
83
-
84
-
85
-
86
-
87
-
88
-
89
-
90
-
91
-
92
-
93
-
94
-
95
-
96
-
97
-
98
-
99
-
100
-
101
-
102
-
103
-
104
-
105
-
106
-
107
-
108
-
109
-
110
-
111
-
112
-
113
-
114
-
115
-
116
-
117
-
118
-
119
-
120
-
121
-
122
-
123
-
124
-
125
-
126
-
127
-
128
-
129
-
130
-
131
-
132
-
133
-
134
-
135
-
136
-
137
 |
 |

Table of Contents
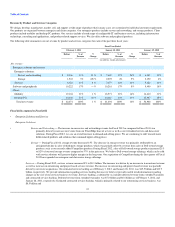
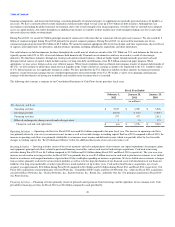
DPO, which was largely attributable to the timing of payments to vendors at the end of the period as compared to the prior year due to an additional week of
operations in Fiscal 2012. The increase in DPO was offset in part by a two day increase in DSO and a two day increase in DSI. The increase in DSO from
January 28, 2011, was due to a shift in the mix of receivables towards customers with longer payment terms. The increase in DSI from January 28, 2011,was
primarily driven by strategic purchases of inventory, particularly HDDs.
Our cash conversion cycle decreased three days at January 28, 2011, from January 29, 2010, driven by a two day increase in DSO and a one day increase in
DSI. DPO was flat year-over-year. The increase in DSO from January 29, 2010, was due to growth in our Commercial business, which typically has longer
payment terms. The slight increase in DSI from January 29, 2010, was primarily attributable to an increase in strategic purchases of materials and finished
goods inventory in connection with the optimization of our supply chain.
We defer the cost of revenue associated with customer shipments not yet recognized as revenue until these shipments are delivered. These deferred costs are
included in our reported DSO because we believe this reporting results in a more accurate presentation of our DSO and cash conversion cycle. These deferred
costs are recorded in Other current assets in our Consolidated Statements of Financial Position and totaled $482 million, $541 million, and $523 million, at
February 3, 2012, January 28, 2011, and January 29, 2010, respectively.
We believe that we can generate cash flow from operations in excess of net income over the long term and can operate our cash conversion cycle in the mid
negative 30 day range.
Capital Commitments
Share Repurchase Program — We have a share repurchase program that authorizes us to purchase shares of our common stock through a systematic program
of open market purchases in order to increase shareholder value and manage dilution resulting from shares issued under our equity compensation plans.
However, we do not currently have a policy that requires the repurchase of common stock to offset share-based compensation arrangements. For more
information regarding our share repurchases, see “Part II — Item 5 — Market for Registrant's Common Equity, Related Stockholder Matters and Issuer
Purchases of Equity Securities.”
Capital Expenditures — During Fiscal 2012 and Fiscal 2011, we spent $675 million and $444 million, respectively, on property, plant, and equipment
primarily in connection with our global expansion efforts and infrastructure investments made to support future growth. Product demand, product mix, and the
increased use of contract manufacturers, as well as ongoing investments in operating and information technology infrastructure, influence the level and
prioritization of our capital expenditures. Aggregate capital expenditures for Fiscal 2013, which will be primarily related to infrastructure investments and
strategic initiatives, are currently expected to total approximately $650 million to $700 million. These expenditures will be primarily funded from our cash
flows from operating activities.
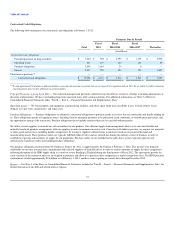
Purchase Obligations — We utilize several suppliers to manufacture sub-assemblies for our products. Our efficient supply chain management allows us to
enter into flexible and mutually beneficial purchase arrangements with our suppliers in order to minimize inventory risk. Consistent with industry practice, we
acquire raw materials or other goods and services, including product components, by issuing to suppliers authorizations to purchase based on our projected
demand and manufacturing needs. See "Liquidity, Capital Commitments, and Contractual Cash Obligations — Contractual Cash Obligations" for more
information about our purchase commitments.
50