Dell 2011 Annual Report Download - page 50
Download and view the complete annual report
Please find page 50 of the 2011 Dell annual report below. You can navigate through the pages in the report by either clicking on the pages listed below, or by using the keyword search tool below to find specific information within the annual report.-
 1
1 -
2
-
3
-
4
-
5
-
6
-
7
-
8
-
9
-
10
-
11
-
12
-
13
-
14
-
15
-
16
-
17
-
18
-
19
-
20
-
21
-
22
-
23
-
24
-
25
-
26
-
27
-
28
-
29
-
30
-
31
-
32
-
33
-
34
-
35
-
36
-
37
-
38
-
39
-
 40
40 -
 41
41 -
 42
42 -
 43
43 -
 44
44 -
 45
45 -
 46
46 -
 47
47 -
 48
48 -
 49
49 -
 50
50 -
 51
51 -
 52
52 -
 53
53 -
 54
54 -
 55
55 -
 56
56 -
 57
57 -
 58
58 -
 59
59 -
 60
60 -
61
-
62
-
63
-
64
-
65
-
66
-
67
-
68
-
69
-
70
-
71
-
72
-
73
-
74
-
75
-
76
-
77
-
78
-
79
-
80
-
81
-
82
-
83
-
84
-
85
-
86
-
87
-
88
-
89
-
90
-
91
-
92
-
93
-
94
-
95
-
96
-
97
-
98
-
99
-
100
-
101
-
102
-
103
-
104
-
105
-
106
-
107
-
108
-
109
-
110
-
111
-
112
-
113
-
114
-
115
-
116
-
117
-
118
-
119
-
120
-
121
-
122
-
123
-
124
-
125
-
126
-
127
-
128
-
129
-
130
-
131
-
132
-
133
-
134
-
135
-
136
-
137
 |
 |

Table of Contents
financing arrangements, and short-term borrowings, consisting primarily of commercial paper, to supplement our internally generated sources of liquidity as
necessary. We have a currently effective shelf registration statement under which we may issue up to $3.5 billion of debt securities. Although there are
uncertainties surrounding the global economic environment, due to the overall strength of our financial position, we believe that we currently have adequate
access to capital markets. Any future disruptions or additional uncertainty or volatility in those markets may result in higher funding costs for us and could
adversely affect our ability to obtain funds.
During Fiscal 2012, we issued $1.5 billion principal amount of senior notes with terms that are consistent with our prior note issuances. We also issued $1.5
billion of commercial paper during Fiscal 2012 primarily for general corporate purposes. During Fiscal 2012, we increased the maximum size of our
commercial paper program from $2.0 billion to $2.5 billion. We intend to maintain appropriate debt levels based upon cash flow expectations, the overall cost
of capital, cash requirements for operations, and discretionary spending, including spending for acquisitions and share repurchases.
Our cash balances are held in numerous locations throughout the world, most of which are outside of the U.S. While our U.S. cash balances do fluctuate, we
typically operate with 10% to 20% of our cash balances held domestically. Demands on our domestic cash have increased as a result of our strategic
initiatives. We fund these initiatives through our existing cash and investment balances, which are highly liquid, through internally generated cash and
through external sources of capital, which include issuances of long-term debt and utilization of our $2.5 billion commercial paper program. When
appropriate, we may access foreign cash in a tax efficient manner. Where local regulations limit an efficient intercompany transfer of amounts held outside of
the U.S., we will continue to utilize these funds for local liquidity needs. Under current law, earnings available to be repatriated to the U.S. would be subject
to U.S. federal income tax, less applicable foreign tax credits. We have provided for the U.S. federal tax liability on these amounts for financial statement
purposes, except for foreign earnings that are considered permanently reinvested outside of the U.S. We utilize a variety of tax planning and financing
strategies with the objective of having our worldwide cash available in the locations where it is needed.
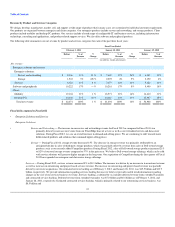
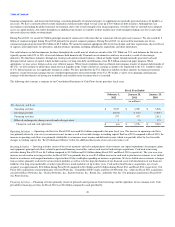
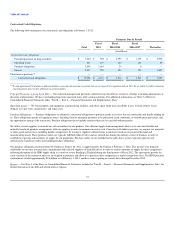
The following table contains a summary of our Consolidated Statements of Cash Flows for the past three fiscal years:
Fiscal Year Ended
February 3,
2012 January 28,
2011 January 29,
2010
(in millions)
Net change in cash from:
Operating activities $ 5,527 $ 3,969 $ 3,906
Investing activities (6,166) (1,165) (3,809)
Financing activities 577 477 2,012
Effect of exchange rate changes on cash and cash equivalents 1 (3) 174
Change in cash and cash equivalents $ (61) $ 3,278 $ 2,283
Operating Activities — Operating cash flows for Fiscal 2012 increased $1.6 billion compared to the prior fiscal year. The increase in operating cash flows
was primarily driven by year-over-year increases in net income as well as favorable changes in working capital. For Fiscal 2011 compared to Fiscal 2010, the
increase in operating cash flows was primarily attributable to an increase in net income and deferred revenue, which was partially offset by less favorable
changes in working capital. See “Key Performance Metrics” below for additional discussion of our cash conversion cycle.
Investing Activities — Investing activities consist of the net of maturities and sales and purchases of investments; net capital expenditures for property, plant,
and equipment; principal cash flows related to purchased financing receivables; and net cash used to fund strategic acquisitions. Cash used in investing
activities during Fiscal 2012 was $6.2 billion compared to $1.2 billion and $3.8 billion during Fiscal 2011 and Fiscal 2010, respectively. The year-over-year
increase in cash used in investing activities for Fiscal 2012 was primarily due to a net $3.2 billion increase in cash used to purchase investments as we shifted
funds to investments with original maturities of greater than 90 days and higher spending on business acquisitions. We have shifted our investments to longer-
term securities primarily to diversify our investment portfolio as well as to better align the duration of our financial assets with the duration of our financial
liabilities. Our long-term marketable securities typically have stated maturities of up to three years. Cash used to fund business acquisitions, net of cash
acquired, was approximately $2.6 billion during Fiscal 2012 compared to $0.4 billion and $3.6 billion during Fiscal 2011 and Fiscal 2010, respectively. Our
Fiscal 2012 acquisitions consisted primarily of SecureWorks Inc., Compellent, DFS Canada, and Force10 Networks, Inc., while our Fiscal 2011 acquisitions
consisted of Kace Networks, Inc., Ocarina Networks, Inc., Scalent Systems, Inc., Boomi, Inc., and InSite One, Inc. Our principal acquisition in Fiscal 2010
was Perot Systems.
Financing Activities — Financing activities primarily consist of proceeds and repayments from borrowings and the repurchase of our common stock. Cash
provided by financing activities for Fiscal 2012 was $0.6 billion compared to cash provided by
48