Costco 2013 Annual Report Download - page 75
Download and view the complete annual report
Please find page 75 of the 2013 Costco annual report below. You can navigate through the pages in the report by either clicking on the pages listed below, or by using the keyword search tool below to find specific information within the annual report.-
 1
1 -
2
-
3
-
4
-
5
-
6
-
7
-
8
-
9
-
10
-
11
-
12
-
13
-
14
-
15
-
16
-
17
-
18
-
19
-
20
-
21
-
22
-
23
-
24
-
25
-
26
-
27
-
28
-
29
-
30
-
31
-
32
-
33
-
34
-
35
-
36
-
37
-
38
-
39
-
40
-
41
-
42
-
43
-
44
-
45
-
46
-
47
-
48
-
49
-
50
-
51
-
52
-
53
-
54
-
55
-
56
-
57
-
58
-
59
-
60
-
61
-
62
-
63
-
64
-
 65
65 -
 66
66 -
 67
67 -
 68
68 -
 69
69 -
 70
70 -
 71
71 -
 72
72 -
 73
73 -
 74
74 -
 75
75 -
 76
76 -
 77
77 -
 78
78 -
 79
79 -
 80
80
 |
 |

73
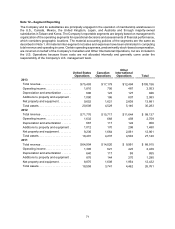
Note 13—Quarterly Financial Data (Unaudited) (Continued)
53 Weeks Ended September 2, 2012
First
Quarter
(12 Weeks)
Second
Quarter
(12 Weeks)
Third
Quarter
(12 Weeks)
Fourth
Quarter
(17 Weeks) Total
(53 Weeks)
REVENUE
Net sales . . . . . . . . . . . . . . . . . . . . $ 21,181 $ 22,508 $ 21,849 $ 31,524 $ 97,062
Membership fees . . . . . . . . . . . . . . 447 459 475 694 2,075
Total revenue. . . . . . . . . . . . . . . 21,628 22,967 22,324 32,218 99,137
OPERATING EXPENSES
Merchandise costs . . . . . . . . . . . . . 18,931 20,139 19,543 28,210 86,823
Selling, general and
administrative . . . . . . . . . . . . . . . 2,144 (1) 2,178 2,152 3,044 9,518
Preopening expenses . . . . . . . . . . 10 6 6 15 37
Operating income . . . . . . . . . . . 543 644 623 949 2,759
OTHER INCOME (EXPENSE)
Interest expense . . . . . . . . . . . . . . (27) (27) (19) (22) (95)
Interest income and other, net . . . . 37 10 18 38 103
INCOME BEFORE INCOME
TAXES 553 627 622 965 2,767
Provision for income taxes. . . . . . . 225 (2) 215 217 343 1,000
Net income including
noncontrolling interests. . . . . . . . 328 412 405 622 1,767
Net income attributable to
noncontrolling interests. . . . . . . . (8) (18) (19) (13) (58)
NET INCOME ATTRIBUTABLE
TO COSTCO. . . . . . . . . . . . . . . . . $ 320 $ 394 $ 386 $ 609 $ 1,709
NET INCOME PER COMMON
SHARE ATTRIBUTABLE TO
COSTCO:
Basic . . . . . . . . . . . . . . . . . . . . . . . $0.74 $ 0.91 $ 0.89 $ 1.41 $ 3.94
Diluted . . . . . . . . . . . . . . . . . . . . . . $0.73 $ 0.90 $ 0.88 $ 1.39 $ 3.89
Shares used in calculation (000’s)
Basic . . . . . . . . . . . . . . . . . . . . . 434,222 434,535 433,791 432,437 433,620
Diluted . . . . . . . . . . . . . . . . . . . . 440,615 439,468 439,166 438,344 439,373
CASH DIVIDENDS DECLARED
PER COMMON SHARE $0.24 $ 0.24 $ 0.00 (3) $ 0.55 (4) $ 1.03
_______________
(1) Includes a $17 charge to selling, general and administrative for contributions to an initiative reforming alcohol beverage laws in
Washington State.
(2) Includes a $24 charge relating to the settlement of an income tax audit in Mexico.
(3) On May 9, 2012, subsequent to the end of the third quarter of 2012, the Board of Directors declared a quarterly cash dividend
of $0.275 per share.
(4) The quarterly dividend rate was $0.275 per share.