Costco 2013 Annual Report Download - page 30
Download and view the complete annual report
Please find page 30 of the 2013 Costco annual report below. You can navigate through the pages in the report by either clicking on the pages listed below, or by using the keyword search tool below to find specific information within the annual report.-
 1
1 -
2
-
3
-
4
-
5
-
6
-
7
-
8
-
9
-
10
-
11
-
12
-
13
-
14
-
15
-
16
-
17
-
18
-
19
-
 20
20 -
 21
21 -
 22
22 -
 23
23 -
 24
24 -
 25
25 -
 26
26 -
 27
27 -
 28
28 -
 29
29 -
 30
30 -
 31
31 -
 32
32 -
 33
33 -
 34
34 -
 35
35 -
 36
36 -
 37
37 -
 38
38 -
 39
39 -
 40
40 -
41
-
42
-
43
-
44
-
45
-
46
-
47
-
48
-
49
-
50
-
51
-
52
-
53
-
54
-
55
-
56
-
57
-
58
-
59
-
60
-
61
-
62
-
63
-
64
-
65
-
66
-
67
-
68
-
69
-
70
-
71
-
72
-
73
-
74
-
75
-
76
-
77
-
78
-
79
-
80
 |
 |

28
Gasoline price inflation positively impacted net sales by approximately $801 or 92 basis points, which resulted
from an 8% increase in the average sales price per gallon during 2012. Changes in foreign currencies relative
to the U.S. dollar negatively impacted net sales by approximately $597, or 69 basis points during 2012,
primarily due to the Canadian dollar, the Mexican peso and the Korean won of approximately $310, $255
and $57, respectively, partially offset by a positive impact of the Japanese yen of approximately $81.
Comparable Sales
Comparable sales increased 7% during 2012, and were positively impacted by increases in both shopping
frequency and the average amount spent by our members. Gasoline price inflation positively impacted
comparable sales results during 2012, while changes in foreign currencies relative to the U.S. dollar negatively
impacted comparable sales. The increase in comparable sales includes the negative impact of cannibalization
(established warehouses losing sales to our newly opened locations).
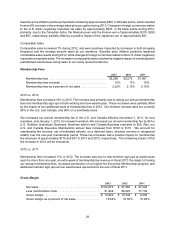
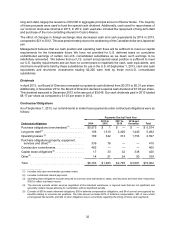
Membership Fees
2013 2012 2011
Membership fees . . . . . . . . . . . . . . . . . . . . . . . . . . . . . . . . . . . . $2,286 $2,075 $1,867
Membership fees increase . . . . . . . . . . . . . . . . . . . . . . . . . . . . . 10% 11% 10%
Membership fees as a percent of net sales . . . . . . . . . . . . . . . . 2.22% 2.13% 2.15%
2013 vs. 2012
Membership fees increased 10% in 2013. The increase was primarily due to raising our annual membership
fees and membership sign-ups at both existing and new warehouses. These increases were partially offset
by the impact of one additional week of membership fees in 2012. Our member renewal rates are currently
90% in the U.S. and Canada, and 86% on a worldwide basis.
We increased our annual membership fee in the U.S. and Canada effective November 1, 2011, for new
members, and January 1, 2012, for renewal members. We increased our annual membership fee by $5 for
U.S. Goldstar (individual), Business, Business add-on and Canada Business members to $55. Also, our
U.S. and Canada Executive Membership annual fees increased from $100 to $110. We account for
membership fee revenue, net of estimated refunds, on a deferred basis, whereby revenue is recognized
ratably over the one-year membership period. These fee increases had a positive impact on membership
fee revenues of approximately $119 and $37 in 2013 and 2012, respectively. The remaining impact of this
fee increase in 2014 will be immaterial.
2012 vs. 2011
Membership fees increased 11% in 2012. The increase was due to new member sign-ups at warehouses
open for more than one year, an extra week of membership fee revenue in fiscal 2012, the impact of raising
our annual membership fees, increased penetration of our higher-fee Executive Membership program, and
additional member sign-ups at new warehouses opened since the end of fiscal 2011.
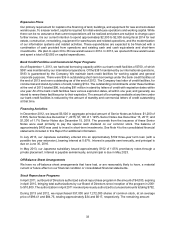
Gross Margin
2013 2012 2011
Net sales . . . . . . . . . . . . . . . . . . . . . . . . . . . . . . . . . . . . . . $102,870 $ 97,062 $ 87,048
Less merchandise costs . . . . . . . . . . . . . . . . . . . . . . . . . . 91,948 86,823 77,739
Gross margin . . . . . . . . . . . . . . . . . . . . . . . . . . . . . . . . . . . $ 10,922 $ 10,239 $ 9,309
Gross margin as a percent of net sales. . . . . . . . . . . . . . . 10.62% 10.55% 10.69%