Costco 2013 Annual Report Download - page 74
Download and view the complete annual report
Please find page 74 of the 2013 Costco annual report below. You can navigate through the pages in the report by either clicking on the pages listed below, or by using the keyword search tool below to find specific information within the annual report.-
 1
1 -
2
-
3
-
4
-
5
-
6
-
7
-
8
-
9
-
10
-
11
-
12
-
13
-
14
-
15
-
16
-
17
-
18
-
19
-
20
-
21
-
22
-
23
-
24
-
25
-
26
-
27
-
28
-
29
-
30
-
31
-
32
-
33
-
34
-
35
-
36
-
37
-
38
-
39
-
40
-
41
-
42
-
43
-
44
-
45
-
46
-
47
-
48
-
49
-
50
-
51
-
52
-
53
-
54
-
55
-
56
-
57
-
58
-
59
-
60
-
61
-
62
-
63
-
 64
64 -
 65
65 -
 66
66 -
 67
67 -
 68
68 -
 69
69 -
 70
70 -
 71
71 -
 72
72 -
 73
73 -
 74
74 -
 75
75 -
 76
76 -
 77
77 -
 78
78 -
 79
79 -
 80
80
 |
 |

72
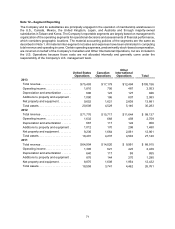
Note 13—Quarterly Financial Data (Unaudited)
The two tables that follow reflect the unaudited quarterly results of operations for 2013 and 2012.
52 Weeks Ended September 1, 2013
First
Quarter
(12 Weeks)
Second
Quarter
(12 Weeks)
Third
Quarter
(12 Weeks)
Fourth
Quarter
(16 Weeks) Total
(52 Weeks)
REVENUE
Net sales . . . . . . . . . . . . . . . . . . . . $ 23,204 $ 24,343 $ 23,552 $ 31,771 $102,870
Membership fees . . . . . . . . . . . . . . 511 528 531 716 2,286
Total revenue. . . . . . . . . . . . . . . 23,715 24,871 24,083 32,487 105,156
OPERATING EXPENSES
Merchandise costs . . . . . . . . . . . . . 20,726 21,766 21,038 28,418 91,948
Selling, general and
administrative . . . . . . . . . . . . . . . 2,332 2,361 2,313 3,098 10,104
Preopening expenses . . . . . . . . . . 18 6 10 17 51
Operating income . . . . . . . . . . . 639 738 722 954 3,053
OTHER INCOME (EXPENSE)
Interest expense . . . . . . . . . . . . . . (13) (25) (25) (36) (99)
Interest income and other, net . . . . 20 26 15 36 97
INCOME BEFORE INCOME
TAXES . . . . . . . . . . . . . . . . . . . . . 646 739 712 954 3,051
Provision for income taxes. . . . . . . 225 185 (1) 248 332 990
Net income including
noncontrolling interests. . . . . . . . 421 554 464 622 2,061
Net income attributable to
noncontrolling interests. . . . . . . . (5) (7) (5) (5) (22)
NET INCOME ATTRIBUTABLE
TO COSTCO. . . . . . . . . . . . . . . . . $ 416 $ 547 $ 459 $ 617 $ 2,039
NET INCOME PER COMMON
SHARE ATTRIBUTABLE TO
COSTCO:
Basic . . . . . . . . . . . . . . . . . . . . . . . $0.96 $ 1.26 $ 1.05 $ 1.41 $ 4.68
Diluted . . . . . . . . . . . . . . . . . . . . . . $0.95 $ 1.24 $ 1.04 $ 1.40 $ 4.63
Shares used in calculation (000’s)
Basic . . . . . . . . . . . . . . . . . . . . . 433,423 435,975 436,488 436,752 435,741
Diluted . . . . . . . . . . . . . . . . . . . . 438,643 439,812 440,780 441,907 440,512
CASH DIVIDENDS DECLARED
PER COMMON SHARE . . . . . . . . $0.275 $ 7.275 (2) $ 0.31 $ 0.31 $ 8.17
_______________
(1) Includes a $62 tax benefit recorded in the second quarter in connection with the special cash dividend paid to employees through
the Company's 401(k) Retirement Plan.
(2) Includes the special cash dividend of $7.00 per share paid in December 2012.