Costco 2013 Annual Report Download - page 31
Download and view the complete annual report
Please find page 31 of the 2013 Costco annual report below. You can navigate through the pages in the report by either clicking on the pages listed below, or by using the keyword search tool below to find specific information within the annual report.-
 1
1 -
2
-
3
-
4
-
5
-
6
-
7
-
8
-
9
-
10
-
11
-
12
-
13
-
14
-
15
-
16
-
17
-
18
-
19
-
20
-
 21
21 -
 22
22 -
 23
23 -
 24
24 -
 25
25 -
 26
26 -
 27
27 -
 28
28 -
 29
29 -
 30
30 -
 31
31 -
 32
32 -
 33
33 -
 34
34 -
 35
35 -
 36
36 -
 37
37 -
 38
38 -
 39
39 -
 40
40 -
 41
41 -
42
-
43
-
44
-
45
-
46
-
47
-
48
-
49
-
50
-
51
-
52
-
53
-
54
-
55
-
56
-
57
-
58
-
59
-
60
-
61
-
62
-
63
-
64
-
65
-
66
-
67
-
68
-
69
-
70
-
71
-
72
-
73
-
74
-
75
-
76
-
77
-
78
-
79
-
80
 |
 |

29
2013 vs. 2012
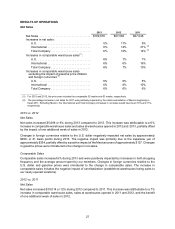
Gross margin as a percentage of net sales increased seven basis points compared to 2012. Gross margin
in our core merchandise categories (food and sundries, hardlines, softlines and fresh foods) when expressed
as a percentage of net sales decreased four basis points, primarily due to a decrease in fresh foods as a
result of our continued investment in merchandise pricing. Warehouse ancillary and other businesses gross
margin when expressed as a percentage of net sales increased by six basis points, predominately in our
optical and hearing aid businesses. Additionally, gross margin was positively impacted by five basis points
due to a $27 LIFO inventory benefit in 2013, compared to a charge of $21 in 2012, and two basis points due
to a legal settlement. The LIFO benefit resulted from lower costs for our merchandise inventories, primarily
hardlines. Executive Membership 2% reward program negatively impacted gross margin by two basis points,
due to increased spending by Executive Members.
Gross margin for core merchandise categories when expressed as a percentage of core merchandise sales
(rather than total net sales) decreased two basis points, primarily due to a decrease in fresh foods.
Gross margin on a geographic segment basis, when expressed as a percentage of the segment’s own sales
(gross margin percentage), increased in our U.S. operation primarily due to improvements in warehouse
ancillary and other businesses. The LIFO benefit and legal settlement also benefited our U.S. operations.
These improvements were slightly offset by a decrease in fresh foods. The gross margin percentage in our
Canadian operations was flat, resulting from a decrease in fresh foods, offset by increases in warehouse
ancillary and other businesses. The gross margin percentage in our Other International segment decreased,
primarily in fresh foods.
2012 vs. 2011
Gross margin as a percent of net sales decreased 14 basis points compared to 2011. Gross margin for core
merchandise categories decreased 21 basis points, primarily due to decreases in hardlines and food and
sundries resulting from our investment in merchandise pricing. Excluding the effect of gasoline price inflation
on net sales, gross margin for core merchandise categories decreased 13 basis points. The gross margin
comparison was positively impacted by eight basis points due to a $21 LIFO inventory charge in 2012
compared to an $87 LIFO charge recorded in 2011. The LIFO charge resulted from higher costs for our
merchandise inventories, primarily food and sundries and gasoline. Increased penetration of the Executive
Membership 2% reward program negatively impacted gross margin by two basis points due to increased
spending by Executive Members.
Selling, General and Administrative Expenses
2013 2012 2011
SG&A expenses . . . . . . . . . . . . . . . . . . . . . . . . . . . . . . . . . . $10,104 $9,518 $8,691
SG&A expenses as a percent of net sales. . . . . . . . . . . . . . . 9.82% 9.81% 9.98%
2013 vs. 2012
SG&A expenses as a percent of net sales increased one basis point compared to 2012. This increase was
driven by higher stock compensation expense of three basis points, partially offset by contributions made
to an initiative reforming alcohol beverage laws in Washington State in the first quarter of 2012, with no
comparable charge in 2013, which resulted in a positive impact of two basis points. Central operating costs
as a percent of net sales were flat, primarily due to the benefit of lower non-equity incentive compensation
costs as a result of not meeting certain internal performance targets. This was offset by higher central
operating costs, predominately related to the continued investment in the modernization of our information
systems in our U.S. operations. Warehouse operating costs as a percentage of net sales was flat, primarily
due to leveraging payroll costs in our U.S. and Canadian operations as a result of increased net sales which
was offset by increases in other operating costs, primarily employee benefits and workers' compensation.