Costco 2013 Annual Report Download - page 63
Download and view the complete annual report
Please find page 63 of the 2013 Costco annual report below. You can navigate through the pages in the report by either clicking on the pages listed below, or by using the keyword search tool below to find specific information within the annual report.-
 1
1 -
2
-
3
-
4
-
5
-
6
-
7
-
8
-
9
-
10
-
11
-
12
-
13
-
14
-
15
-
16
-
17
-
18
-
19
-
20
-
21
-
22
-
23
-
24
-
25
-
26
-
27
-
28
-
29
-
30
-
31
-
32
-
33
-
34
-
35
-
36
-
37
-
38
-
39
-
40
-
41
-
42
-
43
-
44
-
45
-
46
-
47
-
48
-
49
-
50
-
51
-
52
-
 53
53 -
 54
54 -
 55
55 -
 56
56 -
 57
57 -
 58
58 -
 59
59 -
 60
60 -
 61
61 -
 62
62 -
 63
63 -
 64
64 -
 65
65 -
 66
66 -
 67
67 -
 68
68 -
 69
69 -
 70
70 -
 71
71 -
 72
72 -
 73
73 -
74
-
75
-
76
-
77
-
78
-
79
-
80
 |
 |

61
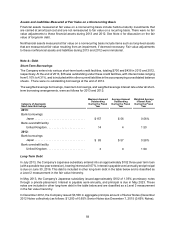
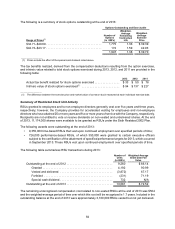
The carrying value and estimated fair value of the Company’s long-term debt at the end of 2013 and 2012
consisted of the following:
2013 2012
Carrying
Value Fair
Value Carrying
Value Fair
Value
5.5% Senior Notes due March 2017 . . . . . . . . . . . . $1,098 $1,248 $1,097 $1,325
0.65% Senior Notes due December 2015 . . . . . . . . 1,199 1,200 0 0
1.125% Senior Notes due December 2017 . . . . . . . 1,100 1,065 0 0
1.7% Senior Notes due December 2019 . . . . . . . . . 1,198 1,157 0 0
Other long-term debt . . . . . . . . . . . . . . . . . . . . . . . . 403 412 285 338
Total long-term debt. . . . . . . . . . . . . . . . . . . . . . . . . 4,998 5,082 1,382 1,663
Less current portion . . . . . . . . . . . . . . . . . . . . . . . . . 0 0 1 1
Long-term debt, excluding current portion . . . . . . . . $4,998 $5,082 $1,381 $1,662
The estimated fair value of the Company’s debt was based primarily on reported market values, recently
completed market transactions, and estimates based upon interest rates, maturities, and credit. Substantially
all of the Company's long-term debt is classified as Level 2.
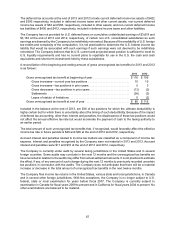
Maturities of long-term debt during the next five fiscal years and thereafter are as follows:
2014 . . . . . . . . . . . . . . . . . . . . . . . . . . . . . . . . . . . . . . . . . . . . . . . . . . . . . . . . . . . . . . . . $ 0
2015 . . . . . . . . . . . . . . . . . . . . . . . . . . . . . . . . . . . . . . . . . . . . . . . . . . . . . . . . . . . . . . . . 0
2016 . . . . . . . . . . . . . . . . . . . . . . . . . . . . . . . . . . . . . . . . . . . . . . . . . . . . . . . . . . . . . . . . 1,301
2017 . . . . . . . . . . . . . . . . . . . . . . . . . . . . . . . . . . . . . . . . . . . . . . . . . . . . . . . . . . . . . . . . 1,099
2018 . . . . . . . . . . . . . . . . . . . . . . . . . . . . . . . . . . . . . . . . . . . . . . . . . . . . . . . . . . . . . . . . 1,196
Thereafter . . . . . . . . . . . . . . . . . . . . . . . . . . . . . . . . . . . . . . . . . . . . . . . . . . . . . . . . . . . . 1,402
Total . . . . . . . . . . . . . . . . . . . . . . . . . . . . . . . . . . . . . . . . . . . . . . . . . . . . . . . . . . . . . $ 4,998
Note 5—Leases
Operating Leases
The aggregate rental expense for 2013, 2012 and 2011 was $225, $220, and $208, respectively. Sub-lease
income, included in interest income and other, net, and contingent rents are not material.
Capital Leases
Gross assets recorded under capital leases were $201 and $187, at the end of 2013 and 2012, respectively.
These assets are recorded net of accumulated amortization of $28 and $19 at the end of 2013 and 2012,
respectively.