Costco 2013 Annual Report Download - page 28
Download and view the complete annual report
Please find page 28 of the 2013 Costco annual report below. You can navigate through the pages in the report by either clicking on the pages listed below, or by using the keyword search tool below to find specific information within the annual report.-
 1
1 -
2
-
3
-
4
-
5
-
6
-
7
-
8
-
9
-
10
-
11
-
12
-
13
-
14
-
15
-
16
-
17
-
 18
18 -
 19
19 -
 20
20 -
 21
21 -
 22
22 -
 23
23 -
 24
24 -
 25
25 -
 26
26 -
 27
27 -
 28
28 -
 29
29 -
 30
30 -
 31
31 -
 32
32 -
 33
33 -
 34
34 -
 35
35 -
 36
36 -
 37
37 -
 38
38 -
39
-
40
-
41
-
42
-
43
-
44
-
45
-
46
-
47
-
48
-
49
-
50
-
51
-
52
-
53
-
54
-
55
-
56
-
57
-
58
-
59
-
60
-
61
-
62
-
63
-
64
-
65
-
66
-
67
-
68
-
69
-
70
-
71
-
72
-
73
-
74
-
75
-
76
-
77
-
78
-
79
-
80
 |
 |
26
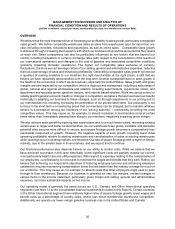
In discussions of our consolidated operating results, we refer to the impact of changes in foreign currencies
relative to the U.S. dollar, which are references to the differences between the foreign-exchange rates we
use to convert the financial results of our international operations from local currencies into U.S. dollars for
financial reporting purposes. This impact of foreign-exchange rate changes is typically calculated as the
difference between the current period's currency exchange rates and the comparable prior-year period's
currency exchange rates.
Our fiscal year ends on the Sunday closest to August 31. Fiscal years 2013 and 2011 were 52-week fiscal
years ending on September 1, 2013 and August 28, 2011, respectively, while fiscal year 2012 was a 53-
week fiscal year ending on September 2, 2012. Certain percentages presented are calculated using actual
results prior to rounding. Unless otherwise noted, references to net income relate to net income attributable
to Costco.
Highlights for fiscal year 2013 included:
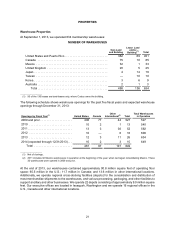
• We opened 26 new warehouses in 2013, 12 in the U.S., three in Canada, and 11 in our Other
International segment, compared to 16 net new warehouses in 2012.
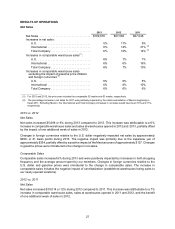
• Net sales increased 6% to $102,870, driven by a 6% increase in comparable sales and sales at
warehouses opened in 2012 and 2013, partially offset by the impact of one additional week of sales
in 2012. Net sales were negatively impacted by changes in certain foreign currencies relative to the
U.S. dollar;
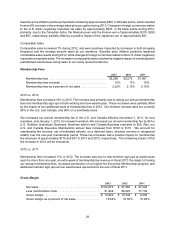
• Membership fees increased 10% to $2,286, primarily due to the impact of raising our annual
membership fees and membership sign-ups at both existing and new warehouses. These increases
were partially offset by the impact of one additional week of fees in 2012;
• Gross margin (net sales less merchandise costs) as a percentage of net sales increased seven basis
points;
• Selling, general and administrative (SG&A) expenses as a percentage of net sales increased one
basis point;
• Net income in 2013 increased 19% to $2,039, or $4.63 per diluted share compared to $1,709, or
$3.89 per diluted share in 2012. These results were positively impacted by a $62 tax benefit, or $0.14
per diluted share, in connection with the special cash dividend paid to the Company's 401(k) Plan
participants;
• In December 2012, we paid a special cash dividend of $7.00 per share (approximately $3,049).
Additionally, in December 2012, we issued $3,500 in aggregate principal amount of Senior Notes;
and
• The Board of Directors approved an increase in the quarterly cash dividend from $0.275 to $0.31 per
share in April 2013.