Costco 2013 Annual Report Download - page 73
Download and view the complete annual report
Please find page 73 of the 2013 Costco annual report below. You can navigate through the pages in the report by either clicking on the pages listed below, or by using the keyword search tool below to find specific information within the annual report.-
 1
1 -
2
-
3
-
4
-
5
-
6
-
7
-
8
-
9
-
10
-
11
-
12
-
13
-
14
-
15
-
16
-
17
-
18
-
19
-
20
-
21
-
22
-
23
-
24
-
25
-
26
-
27
-
28
-
29
-
30
-
31
-
32
-
33
-
34
-
35
-
36
-
37
-
38
-
39
-
40
-
41
-
42
-
43
-
44
-
45
-
46
-
47
-
48
-
49
-
50
-
51
-
52
-
53
-
54
-
55
-
56
-
57
-
58
-
59
-
60
-
61
-
62
-
 63
63 -
 64
64 -
 65
65 -
 66
66 -
 67
67 -
 68
68 -
 69
69 -
 70
70 -
 71
71 -
 72
72 -
 73
73 -
 74
74 -
 75
75 -
 76
76 -
 77
77 -
 78
78 -
 79
79 -
 80
80
 |
 |

71
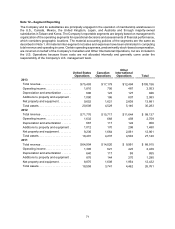
Note 12—Segment Reporting
The Company and its subsidiaries are principally engaged in the operation of membership warehouses in
the U.S., Canada, Mexico, the United Kingdom, Japan, and Australia and through majority-owned
subsidiaries in Taiwan and Korea. The Company’s reportable segments are largely based on management’s
organization of the operating segments for operational decisions and assessments of financial performance,
which considers geographic locations. The material accounting policies of the segments are the same as
described in Note 1. All material inter-segment net sales and expenses have been eliminated in computing
total revenue and operating income. Certain operating expenses, predominantly stock-based compensation,
are incurred on behalf of the Company's Canadian and Other International Operations, but are included in
the U.S. Operations because those costs are not allocated internally and generally come under the
responsibility of the Company's U.S. management team.
United States
Operations Canadian
Operations
Other
International
Operations Total
2013
Total revenue . . . . . . . . . . . . . . . . . . . $75,493 $ 17,179 $12,484 $105,156
Operating income . . . . . . . . . . . . . . . . 1,810 756 487 3,053
Depreciation and amortization . . . . . . 696 123 127 946
Additions to property and equipment . 1,090 186 807 2,083
Net property and equipment . . . . . . . . 9,652 1,621 2,608 13,881
Total assets. . . . . . . . . . . . . . . . . . . . . 20,608 4,529 5,146 30,283
2012
Total revenue . . . . . . . . . . . . . . . . . . . $71,776 $ 15,717 $11,644 $ 99,137
Operating income . . . . . . . . . . . . . . . . 1,632 668 459 2,759
Depreciation and amortization . . . . . . 667 117 124 908
Additions to property and equipment . 1,012 170 298 1,480
Net property and equipment . . . . . . . . 9,236 1,664 2,061 12,961
Total assets. . . . . . . . . . . . . . . . . . . . . 18,401 4,237 4,502 27,140
2011
Total revenue . . . . . . . . . . . . . . . . . . . $64,904 $ 14,020 $ 9,991 $ 88,915
Operating income . . . . . . . . . . . . . . . . 1,395 621 423 2,439
Depreciation and amortization . . . . . . 640 117 98 855
Additions to property and equipment . 876 144 270 1,290
Net property and equipment . . . . . . . . 8,870 1,608 1,954 12,432
Total assets. . . . . . . . . . . . . . . . . . . . . 18,558 3,741 4,462 26,761