Costco 2013 Annual Report Download - page 3
Download and view the complete annual report
Please find page 3 of the 2013 Costco annual report below. You can navigate through the pages in the report by either clicking on the pages listed below, or by using the keyword search tool below to find specific information within the annual report.-
 1
1 -
 2
2 -
 3
3 -
 4
4 -
 5
5 -
 6
6 -
 7
7 -
 8
8 -
 9
9 -
 10
10 -
 11
11 -
 12
12 -
 13
13 -
 14
14 -
15
-
16
-
17
-
18
-
19
-
20
-
21
-
22
-
23
-
24
-
25
-
26
-
27
-
28
-
29
-
30
-
31
-
32
-
33
-
34
-
35
-
36
-
37
-
38
-
39
-
40
-
41
-
42
-
43
-
44
-
45
-
46
-
47
-
48
-
49
-
50
-
51
-
52
-
53
-
54
-
55
-
56
-
57
-
58
-
59
-
60
-
61
-
62
-
63
-
64
-
65
-
66
-
67
-
68
-
69
-
70
-
71
-
72
-
73
-
74
-
75
-
76
-
77
-
78
-
79
-
80
 |
 |

Year
Opened
# of
Whses
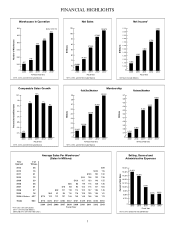
2013 26 $99
2012 15 $105 115
2011 21 $103 120 130
2010 13 $94 106 122 135
2009 20 $100 107 130 146 155
2008 26 $86 83 99 116 128 136
2007 31 $76 88 92 103 116 127 136
2006 27 $92 101 118 114 122 127 136 145
2005 18 $63 81 95 110 116 128 129 136 141
2004 & Before 437 $115 122 131 137 146 140 148 156 165 173
Totals 634 $115 $120 $127 $130 $137 $131 $139 $146 $155 $160
2004 2005 2006 2007 2008 2009 2010 2011 2012 2013
Fiscal Year
Fiscal Year
4PSSPVUZ
2010
0
2,100
1,800
1,900
2,000
1,700
1,500
1,400
1,300
1,200
1,100
1,000
1,600
2011 2012 2013
1,086
2009
1,303
1,462
1,709
2,039
At Fiscal Year End
Number of Warehouses
2010
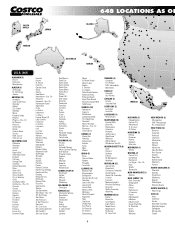
(648 at 12/31/13)
0
525
550
575
2011* 2012* 2013*
527
2009
540
592
608
634
600
650
625
Fiscal Year
)PSSPVUZ
2010 2011* 2012* 2013*
75
80
85
90
95
2009
69.889
0
100
105
76.255
87.048
97.062
102.870
70
Fiscal Year
7LYJLU[0UJYLHZL+LJYLHZL
2010 2011*
-4%
-2%
0%
2%
4%
6%
8%
10%
2012* 2013*
10%
2009
-4%
7% 7%
6%
Fiscal Year
7LYJLU[VM5L[:HSLZ
2009
0
10.10%
10.20%
10.30%
10.40%
10.50%
9.90%
9.80%
10.00%
2010 2011* 2012* 2013*
9.70%
9.81% 9.82%
10.40%
10.29%
9.98%
At Fiscal Year End
2010
5.7
5.8
5.9
6.0
6.1
6.2
6.4
6.5
6.6
6.3
6.7
0
2011* 2013*2012*
5.700
2009
)\ZPULZZ4LTILYZ
At Fiscal Year End
4PSSPVUZ
4PSSPVUZ
2010
0
2011* 2012* 2013*
22.500
25.000
26.700
28.900
2009
.VSK:[HY4LTILYZ
26
23
25
24
21.400
5.800
6.300
6.600
6.400
27
21
22
29
28
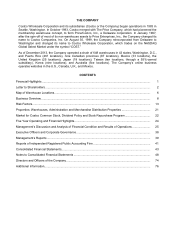
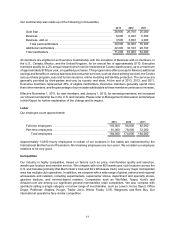
FINANCIAL HIGHLIGHTS
Warehouses in Operation
Comparable Sales Growth
Average Sales Per Warehouse*
(Sales In Millions)
Selling, General and
Administrative Expenses
Membership
Net Sales Net Income*
*2011, 2012 and 2013 Include Mexico
*2011, 2012 and 2013 Include Mexico
*First year sales annualized.
2011 – 2013 Include Mexico.
2006 and 2012 were 53-week years. *2011, 2012 and 2013 Include Mexico
*2011, 2012 and 2013 Include Mexico
*2011, 2012 and 2013 Include Mexico *All Years Include Mexico
1