Costco 2013 Annual Report Download - page 27
Download and view the complete annual report
Please find page 27 of the 2013 Costco annual report below. You can navigate through the pages in the report by either clicking on the pages listed below, or by using the keyword search tool below to find specific information within the annual report.-
 1
1 -
2
-
3
-
4
-
5
-
6
-
7
-
8
-
9
-
10
-
11
-
12
-
13
-
14
-
15
-
16
-
 17
17 -
 18
18 -
 19
19 -
 20
20 -
 21
21 -
 22
22 -
 23
23 -
 24
24 -
 25
25 -
 26
26 -
 27
27 -
 28
28 -
 29
29 -
 30
30 -
 31
31 -
 32
32 -
 33
33 -
 34
34 -
 35
35 -
 36
36 -
 37
37 -
38
-
39
-
40
-
41
-
42
-
43
-
44
-
45
-
46
-
47
-
48
-
49
-
50
-
51
-
52
-
53
-
54
-
55
-
56
-
57
-
58
-
59
-
60
-
61
-
62
-
63
-
64
-
65
-
66
-
67
-
68
-
69
-
70
-
71
-
72
-
73
-
74
-
75
-
76
-
77
-
78
-
79
-
80
 |
 |
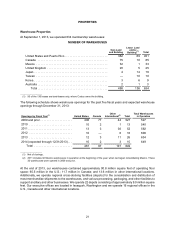
25
MANAGEMENT'S DISCUSSION AND ANALYSIS OF
FINANCIAL CONDITION AND RESULTS OF OPERATIONS
(dollars in millions, except per share, membership fee data, and warehouse number data)
OVERVIEW
We believe that the most important driver of increasing our profitability is sales growth, particularly comparable
sales growth. We define comparable warehouse sales as sales from warehouses open for more than one
year, including remodels, relocations and expansions, as well as online sales. Comparable sales growth
is achieved through increasing the frequency with which our members shop and the amounts that they spend
on each visit. Sales comparisons can also be particularly influenced by two factors that are beyond our
control, including fluctuations in currency exchange rates (with respect to the consolidation of the results of
our international operations) and changes in the cost of gasoline and associated competitive conditions
(primarily impacting domestic operations). The higher our comparable sales exclusive of currency
fluctuations, the more we can leverage certain of our selling, general and administrative expenses, reducing
them as a percentage of sales and enhancing profitability. Generating comparable sales growth is foremost
a question of making available to our members the right merchandise at the right prices, a skill that we
believe we have repeatedly demonstrated over the long term. Another substantial factor in sales growth is
the health of the economies in which we do business, especially the United States. Sales growth and gross
margins are also impacted by our competition, which is vigorous and widespread, including a wide range of
global, national and regional wholesalers and retailers, including supermarkets, supercenter stores, and
department and specialty stores, gasoline stations, and internet-based retailers. While we cannot control or
reliably predict general economic health or changes in competition, we believe that we have been successful
historically in adapting our business to these changes, such as through adjustments to our pricing and to
our merchandise mix, including increasing the penetration of our private label items. Our philosophy is not
to focus in the short term on maximizing prices that our members can be charged, but to maintain what we
believe is a perception among our members of our “pricing authority” – consistently providing the most
competitive values. This may cause us, for example, to absorb increases in merchandise costs at certain
times rather than immediately passing them along to our members, negatively impacting gross margin.
We also achieve sales growth by opening new warehouses and, to a much lesser extent, relocating existing
warehouses to larger and better-located facilities. As our warehouse base grows, available and desirable
potential sites become more difficult to secure, and square footage growth becomes a comparatively less
substantial component of growth. However, the negative aspects of such growth, including lower initial
operating profitability relative to existing warehouses and cannibalization of sales at existing warehouses
when openings occur in existing markets, are lessened. Our rate of square footage growth is higher in foreign
markets, due to the smaller base in those markets, and we expect that to continue.
Our financial performance also depends heavily on our ability to control costs. While we believe that we
have achieved successes in this area historically, some significant costs are partially outside our control,
most particularly health care and utility expenses. With respect to expenses relating to the compensation of
our employees, our philosophy is not to seek to minimize the wages and benefits that they earn. Rather, we
believe that achieving our longer-term objectives of reducing employee turnover and enhancing employee
satisfaction requires maintaining compensation levels that are better than the industry average for much of
our workforce. This may cause us, for example, to absorb costs that other employers might seek to pass
through to their workforces. Because our business is operated on very low margins, modest changes in
various items in the income statement, particularly gross margin and selling, general and administrative
expenses, can have substantial impacts on net income.
Our operating model is generally the same across our U.S., Canada, and Other International operating
segments (see Note 12 to the consolidated financial statements included in this Report). Certain countries
in the Other International segment have relatively higher rates of square footage growth, lower wages and
benefit costs as a percentage of country sales, and/or less direct membership warehouse competition.
Additionally, we operate our lower-margin gasoline business only in the United States and Canada.