Costco 2013 Annual Report Download - page 33
Download and view the complete annual report
Please find page 33 of the 2013 Costco annual report below. You can navigate through the pages in the report by either clicking on the pages listed below, or by using the keyword search tool below to find specific information within the annual report.-
 1
1 -
2
-
3
-
4
-
5
-
6
-
7
-
8
-
9
-
10
-
11
-
12
-
13
-
14
-
15
-
16
-
17
-
18
-
19
-
20
-
21
-
22
-
 23
23 -
 24
24 -
 25
25 -
 26
26 -
 27
27 -
 28
28 -
 29
29 -
 30
30 -
 31
31 -
 32
32 -
 33
33 -
 34
34 -
 35
35 -
 36
36 -
 37
37 -
 38
38 -
 39
39 -
 40
40 -
 41
41 -
 42
42 -
 43
43 -
44
-
45
-
46
-
47
-
48
-
49
-
50
-
51
-
52
-
53
-
54
-
55
-
56
-
57
-
58
-
59
-
60
-
61
-
62
-
63
-
64
-
65
-
66
-
67
-
68
-
69
-
70
-
71
-
72
-
73
-
74
-
75
-
76
-
77
-
78
-
79
-
80
 |
 |

31
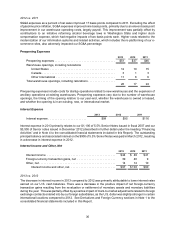
2012 vs. 2011
The increase in interest income in 2012 compared to 2011 was attributable to higher cash balances and
interest rates in our foreign subsidiaries. The changes in foreign-currency transaction gains and losses, net
in 2012 compared to 2011 were related to the revaluation or settlement of monetary assets and monetary
liabilities, primarily our Canadian subsidiary’s U.S. dollar-denominated payables.
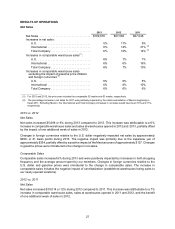
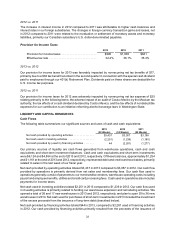
Provision for Income Taxes
2013 2012 2011
Provision for income taxes . . . . . . . . . . . . . . . . . . . . . . $990 $1,000 $841
Effective tax rate . . . . . . . . . . . . . . . . . . . . . . . . . . . . . . 32.4% 36.1% 35.3%
2013 vs. 2012
Our provision for income taxes for 2013 was favorably impacted by nonrecurring net tax benefits of $77,
primarily due to a $62 tax benefit recorded in the second quarter in connection with the special cash dividend
paid to employees through our 401(k) Retirement Plan. Dividends paid on these shares are deductible for
U.S. income tax purposes.
2012 vs. 2011
Our provision for income taxes for 2012 was adversely impacted by nonrecurring net tax expense of $25
relating primarily to the following items: the adverse impact of an audit of Costco Mexico by the Mexican tax
authority; the tax effects of a cash dividend declared by Costco Mexico; and the tax effects of nondeductible
expenses for our contribution to an initiative reforming alcohol beverage laws in Washington State.
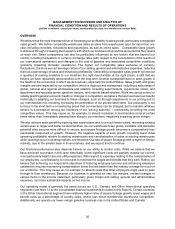
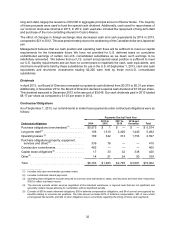
LIQUIDITY AND CAPITAL RESOURCES
Cash Flows
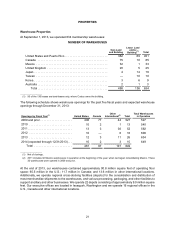
The following table summarizes our significant sources and uses of cash and cash equivalents:
2013 2012 2011
(52 Weeks) (53 Weeks) (52 Weeks)
Net cash provided by operating activities . . . . . . . . . . . . . . $3,437 $3,057 $3,198
Net cash used in investing activities . . . . . . . . . . . . . . . . . . (2,251) (1,236) (1,180)
Net cash provided by (used in) financing activities . . . . . . . 44 (2,281) (1,277)
Our primary sources of liquidity are cash flows generated from warehouse operations, cash and cash
equivalents and short-term investment balances. Cash and cash equivalents and short-term investments
were $6,124 and $4,854 at the end of 2013 and 2012, respectively. Of these balances, approximately $1,254
and $1,161 at the end of 2013 and 2012, respectively, represented debit and credit card receivables, primarily
related to sales in the last week of our fiscal year.
Net cash provided by operating activities totaled $3,437 in 2013 compared to $3,057 in 2012. Our cash flow
provided by operations is primarily derived from net sales and membership fees. Our cash flow used in
operations generally consist of payments to our merchandise vendors, warehouse operating costs including
payroll and employee benefits, utilities and credit card processing fees. Cash used in operations also includes
payments for income taxes.
Net cash used in investing activities totaled $2,251 in 2013 compared to $1,236 in 2012. Our cash flow used
in investing activities is primarily related to funding our warehouse expansion and remodeling activities. We
opened a total of 26 and 17 new warehouses in 2013 and 2012, respectively, and plan to open 30 to 36 new
warehouses in 2014. Net cash used for purchases of short-term investments in 2013 included the investment
of the excess proceeds from the issuance of long-term debt (described below).
Net cash provided by financing activities totaled $44 in 2013, compared to $2,281 used in financing activities
in 2012. Our cash provided by financing activities primarily resulted from the proceeds of the issuance of