Costco 2013 Annual Report Download - page 32
Download and view the complete annual report
Please find page 32 of the 2013 Costco annual report below. You can navigate through the pages in the report by either clicking on the pages listed below, or by using the keyword search tool below to find specific information within the annual report.-
 1
1 -
2
-
3
-
4
-
5
-
6
-
7
-
8
-
9
-
10
-
11
-
12
-
13
-
14
-
15
-
16
-
17
-
18
-
19
-
20
-
21
-
 22
22 -
 23
23 -
 24
24 -
 25
25 -
 26
26 -
 27
27 -
 28
28 -
 29
29 -
 30
30 -
 31
31 -
 32
32 -
 33
33 -
 34
34 -
 35
35 -
 36
36 -
 37
37 -
 38
38 -
 39
39 -
 40
40 -
 41
41 -
 42
42 -
43
-
44
-
45
-
46
-
47
-
48
-
49
-
50
-
51
-
52
-
53
-
54
-
55
-
56
-
57
-
58
-
59
-
60
-
61
-
62
-
63
-
64
-
65
-
66
-
67
-
68
-
69
-
70
-
71
-
72
-
73
-
74
-
75
-
76
-
77
-
78
-
79
-
80
 |
 |

30
2012 vs. 2011
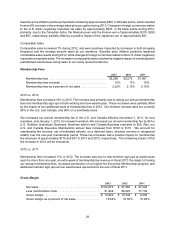
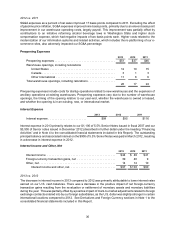
SG&A expenses as a percent of net sales improved 17 basis points compared to 2011. Excluding the effect
of gasoline price inflation, SG&A expenses improved nine basis points, primarily due to an eleven basis point
improvement in our warehouse operating costs, largely payroll. This improvement was partially offset by
contributions to an initiative reforming alcohol beverage laws in Washington State and higher stock
compensation expense, which had negative impacts of two basis points each. Higher costs related to the
modernization of our information systems and related activities, which includes the re-platforming of our e-
commerce sites, also adversely impacted our SG&A percentage.
Preopening Expenses
2013 2012 2011
Preopening expenses . . . . . . . . . . . . . . . . . . . . . . . . . . . . . . . . . . . . . . $51 $37 $46
Warehouse openings, including relocations
United States . . . . . . . . . . . . . . . . . . . . . . . . . . . . . . . . . . . . . . . . . 12 10 15
Canada . . . . . . . . . . . . . . . . . . . . . . . . . . . . . . . . . . . . . . . . . . . . . . 3 1 3
Other International . . . . . . . . . . . . . . . . . . . . . . . . . . . . . . . . . . . . . 11 6 6
Total warehouse openings, including relocations . . . . . . . . . . . . . . . . . 26 17 24
Preopening expenses include costs for startup operations related to new warehouses and the expansion of
ancillary operations at existing warehouses. Preopening expenses vary due to the number of warehouse
openings, the timing of the opening relative to our year-end, whether the warehouse is owned or leased,
and whether the opening is in an existing, new, or international market.
Interest Expense
2013 2012 2011
Interest expense . . . . . . . . . . . . . . . . . . . . . . . . $99 $95 $116
Interest expense in 2013 primarily relates to our $1,100 of 5.5% Senior Notes issued in fiscal 2007 and our
$3,500 of Senior notes issued in December 2012 (described in further detail under the heading “Financing
Activities” and in Note 4 to the consolidated financial statements included in this Report). The outstanding
principal balance and associated interest on the $900 of 5.3% Senior Notes was paid in March 2012, resulting
in a decrease in interest expense in 2012.
Interest Income and Other, Net
2013 2012 2011
Interest income . . . . . . . . . . . . . . . . . . . . . . . . . . . . . . . . . . . . . . . . . . . $44 $ 49 $41
Foreign-currency transaction gains, net . . . . . . . . . . . . . . . . . . . . . . . . 39 40 9
Other, net. . . . . . . . . . . . . . . . . . . . . . . . . . . . . . . . . . . . . . . . . . . . . . . . 14 14 10
Interest income and other, net. . . . . . . . . . . . . . . . . . . . . . . . . . . . . $97 $103 $60
2013 vs. 2012
The decrease in interest income in 2013 compared to 2012 was primarily attributable to lower interest rates
earned on our U.S. cash balances. There was a decrease in the positive impact of net foreign-currency
transaction gains resulting from the revaluation or settlement of monetary assets and monetary liabilities
during the year. This was partially offset by a positive impact of mark-to-market adjustments related to foreign
exchange contracts entered into by our foreign subsidiaries, as the U.S. dollar was slightly stronger in certain
international locations compared to 2012. See Derivatives and Foreign Currency sections in Note 1 to the
consolidated financial statements included in this Report.