Costco 2013 Annual Report Download - page 48
Download and view the complete annual report
Please find page 48 of the 2013 Costco annual report below. You can navigate through the pages in the report by either clicking on the pages listed below, or by using the keyword search tool below to find specific information within the annual report.-
 1
1 -
2
-
3
-
4
-
5
-
6
-
7
-
8
-
9
-
10
-
11
-
12
-
13
-
14
-
15
-
16
-
17
-
18
-
19
-
20
-
21
-
22
-
23
-
24
-
25
-
26
-
27
-
28
-
29
-
30
-
31
-
32
-
33
-
34
-
35
-
36
-
37
-
 38
38 -
 39
39 -
 40
40 -
 41
41 -
 42
42 -
 43
43 -
 44
44 -
 45
45 -
 46
46 -
 47
47 -
 48
48 -
 49
49 -
 50
50 -
 51
51 -
 52
52 -
 53
53 -
 54
54 -
 55
55 -
 56
56 -
 57
57 -
 58
58 -
59
-
60
-
61
-
62
-
63
-
64
-
65
-
66
-
67
-
68
-
69
-
70
-
71
-
72
-
73
-
74
-
75
-
76
-
77
-
78
-
79
-
80
 |
 |

46
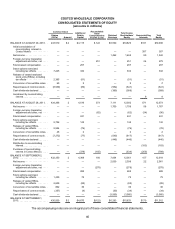
COSTCO WHOLESALE CORPORATION
CONSOLIDATED STATEMENTS OF EQUITY
(amounts in millions)
Common Stock Additional
Paid-in
Capital
Accumulated
Other
Comprehensive
Income (Loss) Retained
Earnings
Total Costco
Stockholders’
Equity Noncontrolling
Interests Total
Equity Shares
(000’s) Amount
BALANCE AT AUGUST 29, 2010 . . 433,510 $ 2 $4,115 $ 122 $6,590 $10,829 $101 $10,930
Initial consolidation of
noncontrolling interest in
Costco Mexico . . . . . . . . . . . . . — — — — — — 357 357
Net income. . . . . . . . . . . . . . . . . . — — — — 1,462 1,462 80 1,542
Foreign-currency translation
adjustment and other, net . . . . — — — 251 — 251 24 275
Stock-based compensation . . . . . — — 207 — — 207 — 207
Stock options exercised,
including tax effects . . . . . . . . . 7,245 — 332 — — 332 — 332
Release of vested restricted
stock units (RSUs), including
tax effects. . . . . . . . . . . . . . . . . 2,385 — (51) — — (51) — (51)
Conversion of convertible notes. . 65 — 2 — — 2 — 2
Repurchases of common stock . . (8,939) — (89) — (552) (641) — (641)
Cash dividends declared . . . . . . . — — — — (389) (389) — (389)
Investment by noncontrolling
interest . . . . . . . . . . . . . . . . . . . — — — — — — 9 9
BALANCE AT AUGUST 28, 2011
. . . 434,266 2 4,516 373 7,111 12,002 571 12,573
Net income. . . . . . . . . . . . . . . . . . — — — — 1,709 1,709 58 1,767
Foreign-currency translation
adjustment and other, net . . . . — — — (62) — (62) (34) (96)
Stock-based compensation . . . . . — — 241 — — 241 — 241
Stock options exercised,
including tax effects . . . . . . . . . 2,756 — 142 — — 142 — 142
Release of vested RSUs,
including tax effects . . . . . . . . . 2,554 — (76) — — (76) — (76)
Conversion of convertible notes. . 46 — 2 — — 2 — 2
Repurchases of common stock . . (7,272) — (77) — (540) (617) — (617)
Cash dividends declared . . . . . . . — — — — (446) (446) — (446)
Distribution to noncontrolling
interest . . . . . . . . . . . . . . . . . . . — — — — — — (183) (183)
Purchase of noncontrolling
interest in Costco Mexico. . . . . — — (379) (155) — (534) (255) (789)
BALANCE AT SEPTEMBER 2,
2012. . . . . . . . . . . . . . . . . . . . . . . 432,350 2 4,369 156 7,834 12,361 157 12,518
Net income. . . . . . . . . . . . . . . . . . — — — — 2,039 2,039 22 2,061
Foreign-currency translation
adjustment and other, net . . . . — — — (278) — (278) — (278)
Stock-based compensation . . . . . — — 285 — — 285 — 285
Stock options exercised,
including tax effects . . . . . . . . . 1,435 — 75 — — 75 — 75
Release of vested RSUs,
including tax effects . . . . . . . . . 2,609 — (85) — — (85) — (85)
Conversion of convertible notes. . 802 — 30 — — 30 — 30
Repurchases of common stock . . (357) — (4) — (30) (34) — (34)
Cash dividends declared . . . . . . . — — — — (3,560) (3,560) — (3,560)
BALANCE AT SEPTEMBER 1,
2013. . . . . . . . . . . . . . . . . . . . . . . 436,839 $2 $4,670 $(122) $6,283 $10,833 $179 $11,012
The accompanying notes are an integral part of these consolidated financial statements.