Costco 2013 Annual Report Download - page 26
Download and view the complete annual report
Please find page 26 of the 2013 Costco annual report below. You can navigate through the pages in the report by either clicking on the pages listed below, or by using the keyword search tool below to find specific information within the annual report.-
 1
1 -
2
-
3
-
4
-
5
-
6
-
7
-
8
-
9
-
10
-
11
-
12
-
13
-
14
-
15
-
 16
16 -
 17
17 -
 18
18 -
 19
19 -
 20
20 -
 21
21 -
 22
22 -
 23
23 -
 24
24 -
 25
25 -
 26
26 -
 27
27 -
 28
28 -
 29
29 -
 30
30 -
 31
31 -
 32
32 -
 33
33 -
 34
34 -
 35
35 -
 36
36 -
37
-
38
-
39
-
40
-
41
-
42
-
43
-
44
-
45
-
46
-
47
-
48
-
49
-
50
-
51
-
52
-
53
-
54
-
55
-
56
-
57
-
58
-
59
-
60
-
61
-
62
-
63
-
64
-
65
-
66
-
67
-
68
-
69
-
70
-
71
-
72
-
73
-
74
-
75
-
76
-
77
-
78
-
79
-
80
 |
 |

24
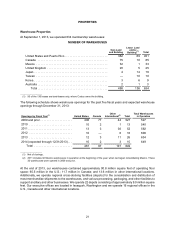
FIVE YEAR OPERATING AND FINANCIAL HIGHLIGHTS
The following table sets forth certain information concerning our consolidated financial condition, operating
results, and key operating metrics. This information should be read in conjunction with Management’s
Discussion and Analysis of Financial Condition and Results of Operations, and our consolidated financial
statements and notes thereto, included in this Report.
SELECTED FINANCIAL DATA
(dollars in millions, except per share and warehouse number data)
Sept. 1,
2013 Sept. 2,
2012 Aug. 28,
2011 Aug. 29,
2010 Aug. 30,
2009
As of and for the year ended (52 weeks) (53 weeks) (52 weeks) (52 weeks) (52 weeks)
RESULTS OF OPERATIONS
Net sales . . . . . . . . . . . . . . . . . . . . . . . . . . . . . . $102,870 $ 97,062 $ 87,048 $ 76,255 $69,889
Merchandise costs . . . . . . . . . . . . . . . . . . . . . . 91,948 86,823 77,739 67,995 62,335
Gross margin . . . . . . . . . . . . . . . . . . . . . . . 10,922 10,239 9,309 8,260 7,554
Membership fees. . . . . . . . . . . . . . . . . . . . . . . . 2,286 2,075 1,867 1,691 1,533
Operating income . . . . . . . . . . . . . . . . . . . . . . . 3,053 2,759 2,439 2,077 1,777
Net income attributable to Costco(1) . . . . . . . . . 2,039 1,709 1,462 1,303 1,086
Net income per diluted common share
attributable to Costco. . . . . . . . . . . . . . . . . . . 4.63 3.89 3.30 2.92 2.47
Cash dividends declared per common share . . $ 8.17 $ 1.03 $ 0.89 $ 0.77 $ 0.68
Increase (decrease) in comparable warehouse
sales(2)
United States . . . . . . . . . . . . . . . . . . . . . . . 6% 7% 7% 4% (2%)
International . . . . . . . . . . . . . . . . . . . . . . . . 6% 6% 16% 19% (8%)
Total . . . . . . . . . . . . . . . . . . . . . . . . . . . . . . 6% 7% 10% 7% (4%)
Increase in international comparable warehouse
sales in local currency . . . . . . . . . . . . . . . . . . . . . 6% 8% 10% 8% 7 %
BALANCE SHEET DATA(3)
Net property and equipment . . . . . . . . . . . . . . . $ 13,881 $ 12,961 $ 12,432 $ 11,314 $10,900
Total assets . . . . . . . . . . . . . . . . . . . . . . . . . . . . 30,283 27,140 26,761 23,815 21,979
Current portion of long-term debt . . . . . . . . . . . — 1 900 — 80
Long-term debt, excluding current portion. . . . . 4,998 1,381 1,253 2,141 2,130
Costco stockholders’ equity. . . . . . . . . . . . . . . . $ 10,833 $ 12,361 $ 12,002 $ 10,829 $ 10,024
WAREHOUSE INFORMATION
Warehouses in Operation(4)
Beginning of year(4) . . . . . . . . . . . . . . . . . . . . . . 608 592 572 527 512
Opened(5) . . . . . . . . . . . . . . . . . . . . . . . . . . . . . 26 17 24 14 19
Closed(5) . . . . . . . . . . . . . . . . . . . . . . . . . . . . . . 0 (1) (4) (1) (4)
End of year . . . . . . . . . . . . . . . . . . . . . . . . . . . . 634 608 592 540 527
(1) Includes 50% of the results of Costco Mexico's operations in fiscal 2009, 2010, 2011, and in 2012 prior to the July acquisition
of our former joint venture partner's 50% equity interest. The remainder of fiscal 2012 and all of fiscal 2013 includes 100% of
Costco Mexico's results of operations.
(2) Includes net sales at warehouses open more than one year, including relocations, remodels, and expansions, as well as online
sales. For fiscal 2013 and 2012, the prior year includes the comparable 52 and 53 weeks, respectively.
(3) Excludes the balance sheet data for Costco Mexico for fiscal 2010 and 2009.
(4) Excludes in 2010 and 2009 warehouses operated in Mexico through a 50% owned joint venture. Mexico opened 32 of these
warehouses in 2009 and prior. The 2011 beginning-of-year figure includes these warehouses consolidated at the beginning of
the fiscal year.
(5) Includes warehouse relocations and the closure in July 2009 of two Costco Home locations.