Costco 2013 Annual Report Download - page 60
Download and view the complete annual report
Please find page 60 of the 2013 Costco annual report below. You can navigate through the pages in the report by either clicking on the pages listed below, or by using the keyword search tool below to find specific information within the annual report.-
 1
1 -
2
-
3
-
4
-
5
-
6
-
7
-
8
-
9
-
10
-
11
-
12
-
13
-
14
-
15
-
16
-
17
-
18
-
19
-
20
-
21
-
22
-
23
-
24
-
25
-
26
-
27
-
28
-
29
-
30
-
31
-
32
-
33
-
34
-
35
-
36
-
37
-
38
-
39
-
40
-
41
-
42
-
43
-
44
-
45
-
46
-
47
-
48
-
49
-
 50
50 -
 51
51 -
 52
52 -
 53
53 -
 54
54 -
 55
55 -
 56
56 -
 57
57 -
 58
58 -
 59
59 -
 60
60 -
 61
61 -
 62
62 -
 63
63 -
 64
64 -
 65
65 -
 66
66 -
 67
67 -
 68
68 -
 69
69 -
 70
70 -
71
-
72
-
73
-
74
-
75
-
76
-
77
-
78
-
79
-
80
 |
 |

58
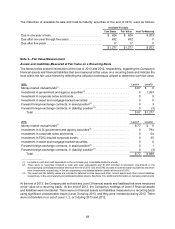
The maturities of available-for-sale and held-to-maturity securities at the end of 2013, were as follows:
Available-For-Sale
Held-To-Maturity
Cost Basis Fair Value
Due in one year or less . . . . . . . . . . . . . . . . . . . . . . . . . . . . . . . . $ 628 $ 628 $ 203
Due after one year through five years . . . . . . . . . . . . . . . . . . . . . 632 632 0
Due after five years . . . . . . . . . . . . . . . . . . . . . . . . . . . . . . . . . . . 17 17 0
$1,277 $1,277 $ 203
Note 3—Fair Value Measurement
Assets and Liabilities Measured at Fair Value on a Recurring Basis
The tables below present information at the end of 2013 and 2012, respectively, regarding the Company’s
financial assets and financial liabilities that are measured at fair value on a recurring basis and indicate the
level within the fair value hierarchy reflecting the valuation techniques utilized to determine such fair value.
2013: Level 1 Level 2
Money market mutual funds(1) . . . . . . . . . . . . . . . . . . . . . . . . . . . . . . . . . . . . . . . . . . . $ 87 $ 0
Investment in government and agency securities(2) . . . . . . . . . . . . . . . . . . . . . . . . . . . 0 1,263
Investment in corporate notes and bonds . . . . . . . . . . . . . . . . . . . . . . . . . . . . . . . . . . 0 9
Investment in asset and mortgage-backed securities . . . . . . . . . . . . . . . . . . . . . . . . . 0 5
Forward foreign-exchange contracts, in asset position(3) . . . . . . . . . . . . . . . . . . . . . . . 0 3
Forward foreign-exchange contracts, in (liability) position(3) . . . . . . . . . . . . . . . . . . . . . 0 (3)
Total . . . . . . . . . . . . . . . . . . . . . . . . . . . . . . . . . . . . . . . . . . . . . . . . . . . . . . . . . . . . $ 87 $1,277
2012: Level 1 Level 2
Money market mutual funds(1) . . . . . . . . . . . . . . . . . . . . . . . . . . . . . . . . . . . . . . . . . . . $ 77 $ 0
Investment in U.S. government and agency securities(2) . . . . . . . . . . . . . . . . . . . . . . . 0 794
Investment in corporate notes and bonds . . . . . . . . . . . . . . . . . . . . . . . . . . . . . . . . . . 0 54
Investment in FDIC-insured corporate bonds . . . . . . . . . . . . . . . . . . . . . . . . . . . . . . . . 0 35
Investment in asset and mortgage-backed securities . . . . . . . . . . . . . . . . . . . . . . . . . 0 8
Forward foreign-exchange contracts, in asset position(3) . . . . . . . . . . . . . . . . . . . . . . . 0 1
Forward foreign-exchange contracts, in (liability) position(3) . . . . . . . . . . . . . . . . . . . . . 0 (3)
Total . . . . . . . . . . . . . . . . . . . . . . . . . . . . . . . . . . . . . . . . . . . . . . . . . . . . . . . . . . . . $ 77 $ 889
_______________
(1) Included in cash and cash equivalents in the accompanying consolidated balance sheets.
(2) There were no securities included in cash and cash equivalents and $1,263 included in short-term investments in the
accompanying consolidated balance sheets at the end of 2013. $12 and $782 included in cash and cash equivalents and short-
term investments, respectively, in the accompanying consolidated balance sheets at the end of 2012.
(3) The asset and the liability values are included in deferred income taxes and other current assets and other current liabilities,
respectively, in the accompanying consolidated balance sheets. See Note 1 for additional information on derivative instruments.
At the end of 2013, the Company did not hold any Level 3 financial assets and liabilities that were measured
at fair value on a recurring basis. At the end of 2012, the Company's holdings of Level 3 financial assets
and liabilities were immaterial. There were no financial assets and liabilities measured on a recurring basis
using significant unobservable inputs (Level 3) during 2013, and they were immaterial during 2012. There
were no transfers in or out of Level 1, 2, or 3 during 2013 and 2012.