Costco 2013 Annual Report Download - page 52
Download and view the complete annual report
Please find page 52 of the 2013 Costco annual report below. You can navigate through the pages in the report by either clicking on the pages listed below, or by using the keyword search tool below to find specific information within the annual report.-
 1
1 -
2
-
3
-
4
-
5
-
6
-
7
-
8
-
9
-
10
-
11
-
12
-
13
-
14
-
15
-
16
-
17
-
18
-
19
-
20
-
21
-
22
-
23
-
24
-
25
-
26
-
27
-
28
-
29
-
30
-
31
-
32
-
33
-
34
-
35
-
36
-
37
-
38
-
39
-
40
-
41
-
 42
42 -
 43
43 -
 44
44 -
 45
45 -
 46
46 -
 47
47 -
 48
48 -
 49
49 -
 50
50 -
 51
51 -
 52
52 -
 53
53 -
 54
54 -
 55
55 -
 56
56 -
 57
57 -
 58
58 -
 59
59 -
 60
60 -
 61
61 -
 62
62 -
63
-
64
-
65
-
66
-
67
-
68
-
69
-
70
-
71
-
72
-
73
-
74
-
75
-
76
-
77
-
78
-
79
-
80
 |
 |

50
are observable in the market or can be derived principally from or corroborated by observable market data,
for which the Company typically receives independent external valuation information.
The Company reports transfers in and out of Levels 1, 2, and 3, as applicable, using the fair value of the
individual securities as of the beginning of the reporting period in which the transfer(s) occurred.
The Company’s current financial liabilities have fair values that approximate their carrying values. The
Company’s long-term financial liabilities consist of long-term debt, which is recorded on the balance sheet
at issuance price and adjusted for any applicable unamortized discounts or premiums.
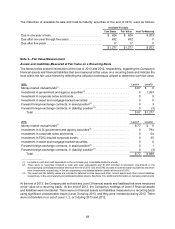
Receivables, Net
Receivables consist of the following at the end of 2013 and 2012:
2013 2012
Vendor receivables . . . . . . . . . . . . . . . . . . . . . . . . . . . . . . . . . . . . . . . . . . . . . . $ 581 $ 545
Reinsurance receivables . . . . . . . . . . . . . . . . . . . . . . . . . . . . . . . . . . . . . . . . . . 238 226
Receivables from governmental entities . . . . . . . . . . . . . . . . . . . . . . . . . . . . . . 228 87
Third-party pharmacy receivables . . . . . . . . . . . . . . . . . . . . . . . . . . . . . . . . . . . 102 104
Other receivables, net . . . . . . . . . . . . . . . . . . . . . . . . . . . . . . . . . . . . . . . . . . . . 52 64
Receivables, net . . . . . . . . . . . . . . . . . . . . . . . . . . . . . . . . . . . . . . . . . . . . . $ 1,201 $ 1,026
Vendor receivables include payments from vendors in the form of volume rebates or other purchase discounts
that are evidenced by signed agreements and are reflected in the carrying value of the inventory when earned
or as the Company progresses towards earning the rebate or discount and as a component of merchandise
costs as the merchandise is sold. Vendor receivable balances are generally presented on a gross basis,
separate from any related payable due. In certain circumstances, these receivables may be settled against
the related payable to that vendor. Other consideration received from vendors is generally recorded as a
reduction of merchandise costs upon completion of contractual milestones, terms of the related agreement,
or by another systematic approach.
Reinsurance receivables are held by the Company’s wholly-owned captive insurance subsidiary. The
receivable balance primarily represents amounts ceded through reinsurance arrangements, and are reflected
on a gross basis, separate from the amounts assumed under reinsurance, which are presented on a gross
basis within other current liabilities on the consolidated balance sheets. Receivables from governmental
entities largely consist of tax-related items. Third-party pharmacy receivables generally relate to amounts
due from members’ insurance companies for the amount above their co-pay, which is collected at the point-
of-sale.
Receivables are recorded net of an allowance for doubtful accounts. Management determines the allowance
for doubtful accounts based on historical experience and application of the specific identification method.
Write-offs of receivables were immaterial for fiscal years 2013, 2012, and 2011.
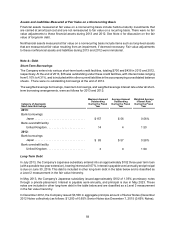
Merchandise Inventories
Merchandise inventories consist of the following at the end of 2013 and 2012:
2013 2012
United States (primarily LIFO) . . . . . . . . . . . . . . . . . . . . . . . . . . . . . . . . . . . . . . $ 5,560 $ 4,967
Foreign (FIFO) . . . . . . . . . . . . . . . . . . . . . . . . . . . . . . . . . . . . . . . . . . . . . . . . . . 2,334 2,129
Merchandise inventories . . . . . . . . . . . . . . . . . . . . . . . . . . . . . . . . . . . . . . . $ 7,894 $ 7,096