Columbia Sportswear 2014 Annual Report Download - page 73
Download and view the complete annual report
Please find page 73 of the 2014 Columbia Sportswear annual report below. You can navigate through the pages in the report by either clicking on the pages listed below, or by using the keyword search tool below to find specific information within the annual report.-
 1
1 -
2
-
3
-
4
-
5
-
6
-
7
-
8
-
9
-
10
-
11
-
12
-
13
-
14
-
15
-
16
-
17
-
18
-
19
-
20
-
21
-
22
-
23
-
24
-
25
-
26
-
27
-
28
-
29
-
30
-
31
-
32
-
33
-
34
-
35
-
36
-
37
-
38
-
39
-
40
-
41
-
42
-
43
-
44
-
45
-
46
-
47
-
48
-
49
-
50
-
51
-
52
-
53
-
54
-
55
-
56
-
57
-
58
-
59
-
60
-
61
-
62
-
 63
63 -
 64
64 -
 65
65 -
 66
66 -
 67
67 -
 68
68 -
 69
69 -
 70
70 -
 71
71 -
 72
72 -
 73
73 -
 74
74 -
 75
75 -
 76
76 -
 77
77 -
 78
78 -
 79
79 -
 80
80 -
 81
81 -
 82
82 -
 83
83 -
84
-
85
-
86
-
87
-
88
-
89
-
90
 |
 |

COLUMBIA SPORTSWEAR COMPANY
NOTES TO CONSOLIDATED FINANCIAL STATEMENTS—(Continued)
69
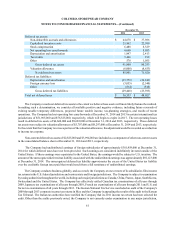
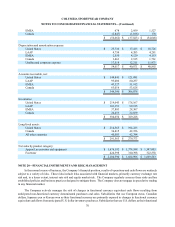
The Company has aggregated its operating segments into four reportable geographic segments: (1) the United States,
(2) Latin America and Asia Pacific (“LAAP”), (3) Europe, Middle East and Africa (“EMEA”), and (4) Canada, which are
reflective of the Company’s internal organization, management, and oversight structure. Each geographic segment operates
predominantly in one industry: the design, development, marketing and distribution of outdoor and active lifestyle apparel,
footwear, accessories and equipment. Intersegment net sales and intersegment profits, which are recorded at a negotiated
mark-up and eliminated in consolidation, are not material. Unallocated corporate expenses consist of expenses incurred
by centrally-managed departments, including global information systems, finance and legal, executive compensation,
unallocated benefit program expense and other miscellaneous costs.
In the first quarter of 2014, the Company reclassified its segment reporting to reflect changes in its internal management
and oversight structure. Certain marketing, product creation and administrative costs incurred by the Company’s corporate
offices, previously included in the United States segment, have been allocated to other geographic regions based on relevant
operational metrics. Other such costs not directly or indirectly allocable to regional segments are now shown below as
unallocated corporate expenses. Prior year amounts have been adjusted to match current year presentation.
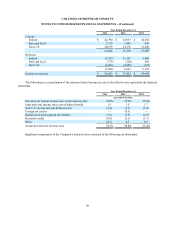
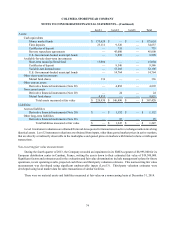
The geographic distribution of the Company’s net sales, income (loss) from operations, interest income (expense),
income tax (expense) benefit, and depreciation and amortization expense are summarized in the following tables (in
thousands) for the years ended December 31, 2014, 2013 and 2012 and for accounts receivable, net and inventories at
December 31, 2014 and 2013.
2014 2013 2012
Net sales to unrelated entities:
United States $ 1,198,405 $ 971,321 $ 946,710
LAAP 491,648 354,345 377,545
EMEA 259,163 240,702 230,624
Canada 151,374 118,628 114,684
$ 2,100,590 $ 1,684,996 $ 1,669,563
Segment income (loss) from operations:
United States $ 229,784 $ 168,395 $ 146,779
LAAP 66,810 55,147 70,230
EMEA 12,667 (3,554) 674
Canada 22,784 13,818 12,666
Total segment income from operations 332,045 233,806 230,349
Unallocated corporate expenses (133,201) (102,012) (96,821)
Interest income, net 1,004 503 379
Interest expense on note payable to related party (1,053) — —
Other non-operating expense (274) (871) —
Income before income tax $ 198,521 $ 131,426 $ 133,907
Interest income (expense), net:
United States $ 4,804 $ 4,501 $ 5,121
LAAP (138) (162) (1,097)
EMEA (661) (556) 293
Canada (3,001) (3,280) (3,938)
$ 1,004 $ 503 $ 379
Income tax (expense) benefit:
United States $ (40,431) $ (28,629) $ (21,961)
LAAP (14,062) (11,135) (13,792)