Columbia Sportswear 2014 Annual Report Download - page 60
Download and view the complete annual report
Please find page 60 of the 2014 Columbia Sportswear annual report below. You can navigate through the pages in the report by either clicking on the pages listed below, or by using the keyword search tool below to find specific information within the annual report.-
 1
1 -
2
-
3
-
4
-
5
-
6
-
7
-
8
-
9
-
10
-
11
-
12
-
13
-
14
-
15
-
16
-
17
-
18
-
19
-
20
-
21
-
22
-
23
-
24
-
25
-
26
-
27
-
28
-
29
-
30
-
31
-
32
-
33
-
34
-
35
-
36
-
37
-
38
-
39
-
40
-
41
-
42
-
43
-
44
-
45
-
46
-
47
-
48
-
49
-
 50
50 -
 51
51 -
 52
52 -
 53
53 -
 54
54 -
 55
55 -
 56
56 -
 57
57 -
 58
58 -
 59
59 -
 60
60 -
 61
61 -
 62
62 -
 63
63 -
 64
64 -
 65
65 -
 66
66 -
 67
67 -
 68
68 -
 69
69 -
 70
70 -
71
-
72
-
73
-
74
-
75
-
76
-
77
-
78
-
79
-
80
-
81
-
82
-
83
-
84
-
85
-
86
-
87
-
88
-
89
-
90
 |
 |

COLUMBIA SPORTSWEAR COMPANY
NOTES TO CONSOLIDATED FINANCIAL STATEMENTS—(Continued)
56
At the time of acquisition, the value of acquired inventory was increased by $1,600,000 based on its estimated fair
value. This valuation adjustment was charged to cost of sales in the second and third quarters of 2014.
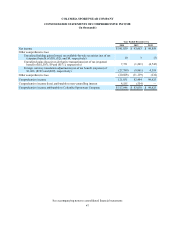
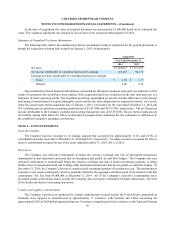
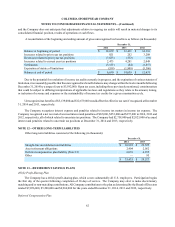
Summary of Unaudited Pro forma Information
The following table reflects the unaudited pro forma consolidated results of operations for the periods presented, as
though the acquisition of prAna had occurred on January 1, 2013 (in thousands):
(unaudited)
Year Ended December 31,
2014 2013
Net sales $ 2,144,022 $ 1,767,505
Net income attributable to Columbia Sportswear Company 145,483 94,170
Earnings per share attributable to Columbia Sportswear Company:
Basic $ 2.08 $ 1.37
Diluted 2.06 1.36
The unaudited pro forma financial information is presented for illustrative purposes only and is not indicative of the
results of operations that would have been realized if the acquisition had been completed on the date indicated, nor is it
indicative of future operating results. The unaudited pro forma consolidated net income includes differences in the amount
and timing of amortization of acquired intangible assets and the fair value adjustment for acquired inventory. As a result,
under the assumed pro forma acquisition date of January 1, 2013, net income for the year ended December 31, 2014 and
2013 includes pre-tax purchase accounting amortization of $3,817,000 and $8,917,000, respectively. The pro forma net
income attributable to the Company excludes nonrecurring transaction costs of $3,387,000. The pro forma results also do
not include, among other items, the effects of anticipated synergies from combining the two companies or differences in
the combined Company's operating cost structure.
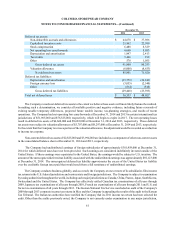
NOTE 4—CONCENTRATIONS
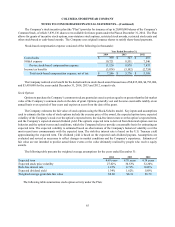
Trade Receivables
The Company had one customer in its Canada segment that accounted for approximately 11.2% and 10.5% of
consolidated accounts receivable at December 31, 2014 and 2013, respectively. No single customer accounted for 10% or
more of consolidated revenues for any of the years ended December 31, 2014, 2013, or 2012.
Derivatives
The Company uses derivative instruments to hedge the currency exchange rate risk of anticipated transactions
denominated in non-functional currencies that are designated and qualify as cash flow hedges. The Company also uses
derivative instruments to economically hedge the currency exchange rate risk of certain investment positions, to hedge
balance sheet re-measurement risk and to hedge other anticipated transactions that do not qualify as cash flow hedges. At
December 31, 2014, the Company’s derivative contracts had a remaining maturity of less than one year. The maximum net
exposure to any single counterparty, which is generally limited to the aggregate unrealized gain of all contracts with that
counterparty, was less than $4,000,000 at December 31, 2014. All of the Company’s derivative counterparties have
investment grade credit ratings and as a result, the Company does not require collateral to facilitate transactions. See Note
20 for further disclosures concerning derivatives.
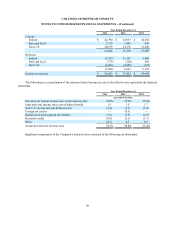
Country and supplier concentrations
The Company’s products are produced by contract manufacturers located outside the United States, principally in
Southeast Asia. Apparel is manufactured in approximately 17 countries, with Vietnam and China accounting for
approximately 68% of 2014 global apparel production. Footwear is manufactured in five countries, with China and Vietnam