Columbia Sportswear 2014 Annual Report Download - page 52
Download and view the complete annual report
Please find page 52 of the 2014 Columbia Sportswear annual report below. You can navigate through the pages in the report by either clicking on the pages listed below, or by using the keyword search tool below to find specific information within the annual report.-
 1
1 -
2
-
3
-
4
-
5
-
6
-
7
-
8
-
9
-
10
-
11
-
12
-
13
-
14
-
15
-
16
-
17
-
18
-
19
-
20
-
21
-
22
-
23
-
24
-
25
-
26
-
27
-
28
-
29
-
30
-
31
-
32
-
33
-
34
-
35
-
36
-
37
-
38
-
39
-
40
-
41
-
 42
42 -
 43
43 -
 44
44 -
 45
45 -
 46
46 -
 47
47 -
 48
48 -
 49
49 -
 50
50 -
 51
51 -
 52
52 -
 53
53 -
 54
54 -
 55
55 -
 56
56 -
 57
57 -
 58
58 -
 59
59 -
 60
60 -
 61
61 -
 62
62 -
63
-
64
-
65
-
66
-
67
-
68
-
69
-
70
-
71
-
72
-
73
-
74
-
75
-
76
-
77
-
78
-
79
-
80
-
81
-
82
-
83
-
84
-
85
-
86
-
87
-
88
-
89
-
90
 |
 |

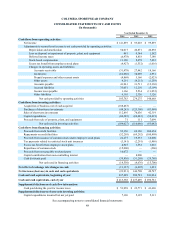
COLUMBIA SPORTSWEAR COMPANY
See accompanying notes to consolidated financial statements
48
CONSOLIDATED STATEMENTS OF CASH FLOWS
(In thousands)
Year Ended December 31,
2014 2013 2012
Cash flows from operating activities:
Net income $ 141,859 $ 93,603 $ 99,859
Adjustments to reconcile net income to net cash provided by operating activities:
Depreciation and amortization 54,017 40,871 40,892
Loss on disposal or impairment of property, plant, and equipment 481 9,344 1,582
Deferred income taxes (6,978) 8,818 7,140
Stock-based compensation 11,120 8,878 7,833
Excess tax benefit from employee stock plans (4,927) (1,532) (1,016)
Changes in operating assets and liabilities:
Accounts receivable (31,478) 27,442 18,166
Inventories (62,086) 34,089 2,951
Prepaid expenses and other current assets (4,869) 5,166 (2,025)
Other assets 4,291 (4,215) (1,259)
Accounts payable 41,941 31,711 (12,330)
Accrued liabilities 35,051 12,210 (5,199)
Income taxes payable 1,166 5,534 (11,052)
Other liabilities 6,195 2,356 3,126
Net cash provided by operating activities 185,783 274,275 148,668
Cash flows from investing activities:
Acquisition of business, net of cash acquired (188,467) — —
Purchases of short-term investments (48,243) (125,390) (83,969)
Sales of short-term investments 112,895 78,636 42,319
Capital expenditures (60,283) (69,443) (50,491)
Proceeds from sale of property, plant, and equipment 71 111 7,099
Net cash used in investing activities (184,027) (116,086) (85,042)
Cash flows from financing activities:
Proceeds from credit facilities 52,356 69,136 100,654
Repayments on credit facilities (52,205) (69,292) (100,498)
Proceeds from issuance of common stock under employee stock plans 22,277 19,537 14,600
Tax payments related to restricted stock unit issuances (3,141) (2,291) (1,486)
Excess tax benefit from employee stock plans 4,927 1,532 1,016
Repurchase of common stock (15,000) — (206)
Proceeds from note payable to related party 16,072 — —
Capital contribution from non-controlling interest — 8,000 —
Cash dividends paid (39,836) (31,298) (29,780)
Net cash used in financing activities (14,550) (4,676) (15,700)
Net effect of exchange rate changes on cash (11,137) (6,805) 1,821
Net increase (decrease) in cash and cash equivalents (23,931) 146,708 49,747
Cash and cash equivalents, beginning of year 437,489 290,781 241,034
Cash and cash equivalents, end of year $ 413,558 $ 437,489 $ 290,781
Supplemental disclosures of cash flow information:
Cash paid during the year for income taxes $ 53,958 $ 22,771 $ 43,696
Supplemental disclosures of non-cash investing activities:
Capital expenditures incurred but not yet paid 7,196 5,195 5,313