Columbia Sportswear 2014 Annual Report Download - page 29
Download and view the complete annual report
Please find page 29 of the 2014 Columbia Sportswear annual report below. You can navigate through the pages in the report by either clicking on the pages listed below, or by using the keyword search tool below to find specific information within the annual report.-
 1
1 -
2
-
3
-
4
-
5
-
6
-
7
-
8
-
9
-
10
-
11
-
12
-
13
-
14
-
15
-
16
-
17
-
18
-
 19
19 -
 20
20 -
 21
21 -
 22
22 -
 23
23 -
 24
24 -
 25
25 -
 26
26 -
 27
27 -
 28
28 -
 29
29 -
 30
30 -
 31
31 -
 32
32 -
 33
33 -
 34
34 -
 35
35 -
 36
36 -
 37
37 -
 38
38 -
 39
39 -
40
-
41
-
42
-
43
-
44
-
45
-
46
-
47
-
48
-
49
-
50
-
51
-
52
-
53
-
54
-
55
-
56
-
57
-
58
-
59
-
60
-
61
-
62
-
63
-
64
-
65
-
66
-
67
-
68
-
69
-
70
-
71
-
72
-
73
-
74
-
75
-
76
-
77
-
78
-
79
-
80
-
81
-
82
-
83
-
84
-
85
-
86
-
87
-
88
-
89
-
90
 |
 |

25
PART II
Item 5. MARKET FOR REGISTRANT’S COMMON EQUITY, RELATED STOCKHOLDER MATTERS AND
ISSUER PURCHASES OF EQUITY SECURITIES
Our common stock is listed on the NASDAQ Global Select Market and trades under the symbol “COLM.” At
February 13, 2015, we had approximately 313 shareholders of record. All references below to per share amounts have been
retroactively adjusted to reflect our September 26, 2014 two-for-one stock split.
Following are the quarterly high and low sale prices for our common stock for the years ended December 31, 2014
and 2013:
HIGH LOW DIVIDENDS
DECLARED
2014
First Quarter $44.13 $36.09 $0.14
Second Quarter $44.98 $38.72 $0.14
Third Quarter $42.69 $35.14 $0.14
Fourth Quarter $45.87 $34.25 $0.15
2013
First Quarter $29.97 $23.86 $0.11
Second Quarter $31.64 $28.06 $0.11
Third Quarter $33.35 $27.79 $0.11
Fourth Quarter $39.74 $28.94 $0.13
Our current dividend policy is dependent on our earnings, capital requirements, financial condition, restrictions
imposed by our credit agreements, and other factors considered relevant by our Board of Directors. For various restrictions
on our ability to pay dividends, see Note 9 of Notes to Consolidated Financial Statements.
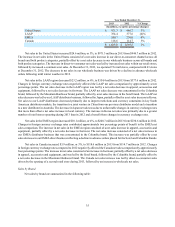
Performance Graph
The line graph below compares the cumulative total shareholder return of our common stock with the cumulative
total return of the Standard & Poor’s (“S&P”) 400 Mid-Cap Index and the Russell 3000 Textiles Apparel Manufacturers
for the period beginning December 31, 2009 and ending December 31, 2014. The graph assumes that $100 was invested
on December 31, 2009, and that any dividends were reinvested.
Historical stock price performance should not be relied on as indicative of future stock price performance.