Columbia Sportswear 2014 Annual Report Download - page 39
Download and view the complete annual report
Please find page 39 of the 2014 Columbia Sportswear annual report below. You can navigate through the pages in the report by either clicking on the pages listed below, or by using the keyword search tool below to find specific information within the annual report.-
 1
1 -
2
-
3
-
4
-
5
-
6
-
7
-
8
-
9
-
10
-
11
-
12
-
13
-
14
-
15
-
16
-
17
-
18
-
19
-
20
-
21
-
22
-
23
-
24
-
25
-
26
-
27
-
28
-
 29
29 -
 30
30 -
 31
31 -
 32
32 -
 33
33 -
 34
34 -
 35
35 -
 36
36 -
 37
37 -
 38
38 -
 39
39 -
 40
40 -
 41
41 -
 42
42 -
 43
43 -
 44
44 -
 45
45 -
 46
46 -
 47
47 -
 48
48 -
 49
49 -
50
-
51
-
52
-
53
-
54
-
55
-
56
-
57
-
58
-
59
-
60
-
61
-
62
-
63
-
64
-
65
-
66
-
67
-
68
-
69
-
70
-
71
-
72
-
73
-
74
-
75
-
76
-
77
-
78
-
79
-
80
-
81
-
82
-
83
-
84
-
85
-
86
-
87
-
88
-
89
-
90
 |
 |
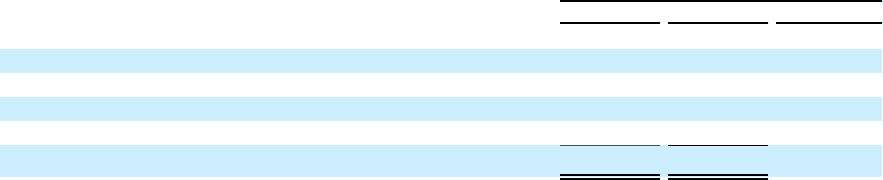
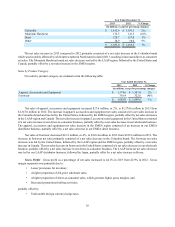
35
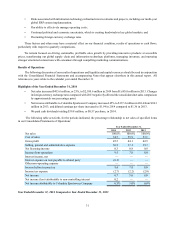
Year Ended December 31,
2013 2012 % Change
(In millions, except for percentage changes)
United States $ 971.3 $ 946.7 3%
LAAP 354.4 377.6 (6)%
EMEA 240.7 230.6 4%
Canada 118.6 114.7 3%
$ 1,685.0 $ 1,669.6 1%
Net sales in the United States increased $24.6 million, or 3%, to $971.3 million in 2013 from $946.7 million in 2012.
The increase in net sales in the United States consisted of a net sales increase in our direct-to-consumer channel across all
brands and both product categories, partially offset by a net sales decrease in our wholesale business across all brands and
both product categories. The increase in direct-to-consumer net sales was led by increased net sales within our retail stores,
followed by increased e-commerce net sales. At December 31, 2013, we operated 72 retail stores, compared with 63 stores
at December 31, 2012. The decrease in net sales in our wholesale business was driven by a decline in advance wholesale
orders following mild winter weather in 2012.
Net sales in the LAAP region decreased $23.2 million, or 6%, to $354.4 million in 2013 from $377.6 million in 2012.
Changes in foreign currency exchange rates negatively affected the LAAP net sales comparison by approximately seven
percentage points. The net sales decrease in the LAAP region was led by a net sales decrease in apparel, accessories and
equipment, followed by a net sales decrease in footwear. The LAAP net sales decrease was concentrated in the Columbia
brand, followed by the Mountain Hardwear brand, partially offset by a net sales increase in the Sorel brand. The LAAP net
sales decrease was led by our LAAP distributor business, followed by Japan, partially offset by a net sales increase in Korea.
Net sales to our LAAP distributors decreased primarily due to import restrictions and currency constraints in key South
American distributor markets, the transition to a joint venture in China from our previous distributor model and a transition
to a new distributor in Australia. The decrease in Japan net sales was due to unfavorable changes in currency exchange rates
that more than offset a net sales increase in local currency. The increase in Korea net sales was primarily due to a greater
number of retail stores operating during 2013 than in 2012 and a benefit from changes in currency exchange rates.
Net sales in the EMEA region increased $10.1 million, or 4%, to $240.7 million in 2013 from $230.6 million in 2012.
Changes in foreign currency exchange rates contributed approximately two percentage points of benefit to the EMEA net
sales comparison. The increase in net sales in the EMEA region consisted of a net sales increase in apparel, accessories and
equipment, partially offset by a net sales decrease in footwear. The net sales increase consisted of a net sales increase in
our EMEA distributor business that was concentrated in the Columbia brand. This increase was partially offset by a net
sales decrease in our EMEA direct business reflecting a decline in advance orders placed for the Sorel and Columbia brands.
Net sales in Canada increased $3.9 million, or 3%, to $118.6 million in 2013 from $114.7 million in 2012. Changes
in foreign currency exchange rates compared to 2012 negatively affected the Canada net sales comparison by approximately
four percentage points. The increase in net sales consisted of an increase in footwear, partially offset by a net sales decrease
in apparel, accessories and equipment, and was led by the Sorel brand, followed by the Columbia brand, partially offset by
a net sales decrease in the Mountain Hardwear brand. The Canada net sales increase was led by direct-to-consumer sales
driven by the opening of a second retail store during 2013, followed by an increase in wholesale net sales.
Sales by Brand
Net sales by brand are summarized in the following table: