Columbia Sportswear 2014 Annual Report Download - page 38
Download and view the complete annual report
Please find page 38 of the 2014 Columbia Sportswear annual report below. You can navigate through the pages in the report by either clicking on the pages listed below, or by using the keyword search tool below to find specific information within the annual report.-
 1
1 -
2
-
3
-
4
-
5
-
6
-
7
-
8
-
9
-
10
-
11
-
12
-
13
-
14
-
15
-
16
-
17
-
18
-
19
-
20
-
21
-
22
-
23
-
24
-
25
-
26
-
27
-
 28
28 -
 29
29 -
 30
30 -
 31
31 -
 32
32 -
 33
33 -
 34
34 -
 35
35 -
 36
36 -
 37
37 -
 38
38 -
 39
39 -
 40
40 -
 41
41 -
 42
42 -
 43
43 -
 44
44 -
 45
45 -
 46
46 -
 47
47 -
 48
48 -
49
-
50
-
51
-
52
-
53
-
54
-
55
-
56
-
57
-
58
-
59
-
60
-
61
-
62
-
63
-
64
-
65
-
66
-
67
-
68
-
69
-
70
-
71
-
72
-
73
-
74
-
75
-
76
-
77
-
78
-
79
-
80
-
81
-
82
-
83
-
84
-
85
-
86
-
87
-
88
-
89
-
90
 |
 |
34
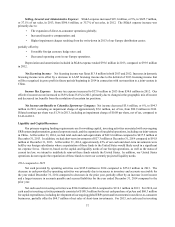
Our gross profit may not be comparable to those of other companies in our industry because some of these companies
include all of the costs related to their distribution network in cost of sales while we, like many others, include these expenses
as a component of selling, general and administrative ("SG&A") expense.
Selling, General and Administrative Expense: SG&A expense includes all costs associated with our design,
merchandising, marketing, distribution and corporate functions, including related depreciation and amortization.
SG&A expense increased $137.4 million, or 22%, to $763.1 million, or 36.3% of net sales, in 2014, from $625.7
million, or 37.1% of net sales, in 2013. The SG&A expense increase was primarily due to:
• Incremental operating costs associated with the China joint venture and prAna;
• Increased demand creation expenses;
• The expansion of our direct-to-consumer operations globally;
• Increased operating costs of our new ERP and related information technology initiatives; and
• Increased personnel and incentive compensation costs;
partially offset by:
• Non-recurrence of a 2013 impairment charge to write-down the carrying amount of our Europe distribution
center; and
• Favorable foreign currency exchange rates.
Depreciation and amortization included in SG&A expense totaled $49.2 million in 2014, compared to $39.6 million
in 2013.
Net Licensing Income: Net licensing income decreased $6.8 million to $7.0 million in 2014, compared to $13.8
million in 2013. The decrease in net licensing income was concentrated in the LAAP region and was a result of the effect
of including in gross profit amounts that were previously recognized in licensing income prior to the commencement of
our China joint venture.
Income Tax Expense: Income tax expense increased to $56.7 million in 2014 from $37.8 million in 2013. Our
effective income tax rate decreased to 28.5% from 28.8% in 2013.
Net Income attributable to Columbia Sportswear Company: Net income increased $42.9 million, or 45%, to $137.2
million in 2014 from $94.3 million in 2013. Diluted earnings per share was $1.94 in 2014 compared to $1.36 in 2013.
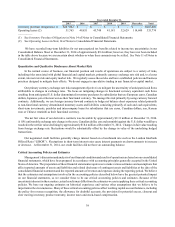
Year Ended December 31, 2013 Compared to Year Ended December 31, 2012
Net Sales: Consolidated net sales increased $15.4 million, or 1%, to $1,685.0 million in 2013 from $1,669.6 million
in 2012. Changes in foreign currency exchange rates compared with 2012 negatively affected the net sales comparison by
approximately one percentage point.
Sales by Geographic Region
Net sales by geographic region are summarized in the following table: