Columbia Sportswear 2014 Annual Report Download - page 41
Download and view the complete annual report
Please find page 41 of the 2014 Columbia Sportswear annual report below. You can navigate through the pages in the report by either clicking on the pages listed below, or by using the keyword search tool below to find specific information within the annual report.-
 1
1 -
2
-
3
-
4
-
5
-
6
-
7
-
8
-
9
-
10
-
11
-
12
-
13
-
14
-
15
-
16
-
17
-
18
-
19
-
20
-
21
-
22
-
23
-
24
-
25
-
26
-
27
-
28
-
29
-
30
-
 31
31 -
 32
32 -
 33
33 -
 34
34 -
 35
35 -
 36
36 -
 37
37 -
 38
38 -
 39
39 -
 40
40 -
 41
41 -
 42
42 -
 43
43 -
 44
44 -
 45
45 -
 46
46 -
 47
47 -
 48
48 -
 49
49 -
 50
50 -
 51
51 -
52
-
53
-
54
-
55
-
56
-
57
-
58
-
59
-
60
-
61
-
62
-
63
-
64
-
65
-
66
-
67
-
68
-
69
-
70
-
71
-
72
-
73
-
74
-
75
-
76
-
77
-
78
-
79
-
80
-
81
-
82
-
83
-
84
-
85
-
86
-
87
-
88
-
89
-
90
 |
 |
37
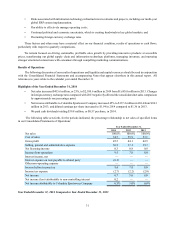
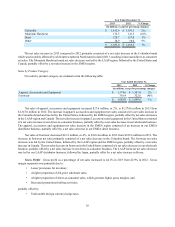
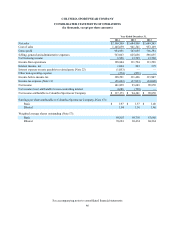
Selling, General and Administrative Expense: SG&A expense increased $29.1 million, or 5%, to $625.7 million,
or 37.1% of net sales, in 2013, from $596.6 million, or 35.7% of net sales, in 2012. The SG&A expense increase was
primarily due to:
• The expansion of direct-to-consumer operations globally;
• Increased incentive compensation; and
• Higher impairment charges resulting from the write-down in 2013 of our Europe distribution center;
partially offset by:
• Favorable foreign currency hedge rates; and
• Decreased operating costs in our Europe operations.
Depreciation and amortization included in SG&A expense totaled $39.6 million in 2013, compared to $39.9 million
in 2012.
Net Licensing Income: Net licensing income was flat at $13.8 million in both 2013 and 2012. Increases in domestic
licensing income were offset by a decrease in LAAP licensing income due to the deferral of 2013 licensing income that
will be recognized in gross profit in future periods beginning in 2014 in connection with our transition to a joint venture in
China.
Income Tax Expense: Income tax expense increased to $37.8 million in 2013 from $34.0 million in 2012. Our
effective income tax rate increased to 28.8% from 25.4% in 2012, primarily due to changes in the geographic mix of income
and decreased tax benefits from the resolution of uncertain tax positions.
Net Income attributable to Columbia Sportswear Company: Net income decreased $5.6 million, or 6%, to $94.3
million in 2013, including an impairment charge of approximately $5.6 million, net of tax, from $99.9 million in 2012.
Diluted earnings per share was $1.36 in 2013, including an impairment charge of $0.08 per share, net of tax, compared to
$1.46 in 2012.
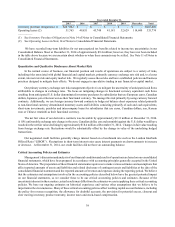
Liquidity and Capital Resources
Our primary ongoing funding requirements are for working capital, investing activities associated with our ongoing
ERP system implementation, general corporate needs, and the expansion of our global operations, including our joint venture
in China. At December 31, 2014, we had total cash and cash equivalents of $413.6 million compared to $437.5 million at
December 31, 2013. In addition, we had short-term investments of $27.3 million at December 31, 2014 compared to $91.8
million at December 31, 2013. At December 31, 2014, approximately 43% of our cash and short-term investments were
held by our foreign subsidiaries where a repatriation of those funds to the United States would likely result in a significant
tax expense for us. However, based on the capital and liquidity needs of our foreign operations, as well as the status of
current tax law, we intend to indefinitely reinvest these funds outside the United States. In addition, our United States
operations do not require the repatriation of these funds to meet our currently projected liquidity needs.
2014 compared to 2013
Net cash provided by operating activities was $185.8 million in 2014 compared to $274.3 million in 2013. The
decrease in cash provided by operating activities was primarily due to increases in inventory and accounts receivable for
the year ended December 31, 2014 compared to decreases in the prior year, partially offset by an increase in net income
and a larger increase in accounts payable and accrued liabilities for the year ended December 31, 2014 compared to the
prior year.
Net cash used in investing activities was $184.0 million in 2014 compared to $116.1 million in 2013. For 2014, net
cash used in investing activities primarily consisted of $188.5 million for the net cash purchase of prAna and $60.3 million
for capital expenditures, including development of our ongoing global ERP system and investments in our direct-to-consumer
businesses, partially offset by $64.7 million of net sales of short-term investments. For 2013, net cash used in investing