Columbia Sportswear 2014 Annual Report Download - page 35
Download and view the complete annual report
Please find page 35 of the 2014 Columbia Sportswear annual report below. You can navigate through the pages in the report by either clicking on the pages listed below, or by using the keyword search tool below to find specific information within the annual report.-
 1
1 -
2
-
3
-
4
-
5
-
6
-
7
-
8
-
9
-
10
-
11
-
12
-
13
-
14
-
15
-
16
-
17
-
18
-
19
-
20
-
21
-
22
-
23
-
24
-
 25
25 -
 26
26 -
 27
27 -
 28
28 -
 29
29 -
 30
30 -
 31
31 -
 32
32 -
 33
33 -
 34
34 -
 35
35 -
 36
36 -
 37
37 -
 38
38 -
 39
39 -
 40
40 -
 41
41 -
 42
42 -
 43
43 -
 44
44 -
 45
45 -
46
-
47
-
48
-
49
-
50
-
51
-
52
-
53
-
54
-
55
-
56
-
57
-
58
-
59
-
60
-
61
-
62
-
63
-
64
-
65
-
66
-
67
-
68
-
69
-
70
-
71
-
72
-
73
-
74
-
75
-
76
-
77
-
78
-
79
-
80
-
81
-
82
-
83
-
84
-
85
-
86
-
87
-
88
-
89
-
90
 |
 |
31
• Risks associated with information technology infrastructure investments and projects, including our multi-year
global ERP system implementation;
• Our ability to effectively manage operating costs;
• Continued political and economic uncertainty, which is creating headwinds in key global markets; and
• Fluctuating foreign currency exchange rates.
These factors and others may have a material effect on our financial condition, results of operations or cash flows,
particularly with respect to quarterly comparisons.
We remain focused on driving sustainable, profitable sales growth by providing innovative products at accessible
prices, transforming our global supply chain and information technology platforms, managing inventory, and nurturing
stronger emotional connections with consumers through compelling marketing communications.
Results of Operations
The following discussion of our results of operations and liquidity and capital resources should be read in conjunction
with the Consolidated Financial Statements and accompanying Notes that appear elsewhere in this annual report. All
references to years relate to the calendar year ended December 31.
Highlights of the Year Ended December 31, 2014
• Net sales increased $415.6 million, or 25%, to $2,100.6 million in 2014 from $1,685.0 million in 2013. Changes
in foreign currency exchange rates compared with 2013 negatively affected the consolidated net sales comparison
by approximately one percentage point.
• Net income attributable to Columbia Sportswear Company increased 45% to $137.2 million in 2014 from $94.3
million in 2013, and diluted earnings per share increased to $1.94 in 2014 compared to $1.36 in 2013.
• We paid cash dividends totaling $39.8 million, or $0.57 per share, in 2014.
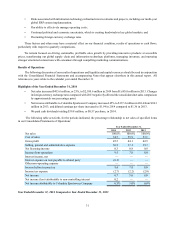
The following table sets forth, for the periods indicated, the percentage relationship to net sales of specified items
in our Consolidated Statements of Operations:
Year Ended December 31,
2014 2013 2012
Net sales 100.0% 100.0% 100.0%
Cost of sales 54.5 55.9 57.1
Gross profit 45.5 44.1 42.9
Selling, general and administrative expense 36.3 37.1 35.7
Net licensing income 0.3 0.8 0.8
Income from operations 9.5 7.8 8.0
Interest income, net — — —
Interest expense on note payable to related party (0.1) — —
Other non-operating expense — — —
Income before income tax 9.4 7.8 8.0
Income tax expense (2.7) (2.2) (2.0)
Net income 6.7 5.6 6.0
Net income (loss) attributable to non-controlling interest 0.2 — —
Net income attributable to Columbia Sportswear Company 6.5% 5.6% 6.0%
Year Ended December 31, 2014 Compared to Year Ended December 31, 2013