Columbia Sportswear 2014 Annual Report Download - page 71
Download and view the complete annual report
Please find page 71 of the 2014 Columbia Sportswear annual report below. You can navigate through the pages in the report by either clicking on the pages listed below, or by using the keyword search tool below to find specific information within the annual report.-
 1
1 -
2
-
3
-
4
-
5
-
6
-
7
-
8
-
9
-
10
-
11
-
12
-
13
-
14
-
15
-
16
-
17
-
18
-
19
-
20
-
21
-
22
-
23
-
24
-
25
-
26
-
27
-
28
-
29
-
30
-
31
-
32
-
33
-
34
-
35
-
36
-
37
-
38
-
39
-
40
-
41
-
42
-
43
-
44
-
45
-
46
-
47
-
48
-
49
-
50
-
51
-
52
-
53
-
54
-
55
-
56
-
57
-
58
-
59
-
60
-
 61
61 -
 62
62 -
 63
63 -
 64
64 -
 65
65 -
 66
66 -
 67
67 -
 68
68 -
 69
69 -
 70
70 -
 71
71 -
 72
72 -
 73
73 -
 74
74 -
 75
75 -
 76
76 -
 77
77 -
 78
78 -
 79
79 -
 80
80 -
 81
81 -
82
-
83
-
84
-
85
-
86
-
87
-
88
-
89
-
90
 |
 |

COLUMBIA SPORTSWEAR COMPANY
NOTES TO CONSOLIDATED FINANCIAL STATEMENTS—(Continued)
67
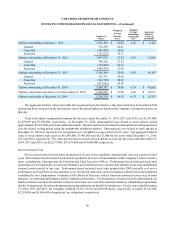
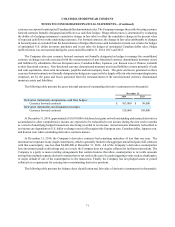
The fair value of service-based and performance-based restricted stock units is discounted by the present value of the
estimated future stream of dividends over the vesting period using the Black-Scholes model. The relevant inputs and
assumptions used in the Black-Scholes model to compute the discount are the vesting period, expected annual dividend
yield and closing price of the Company’s common stock on the date of grant.
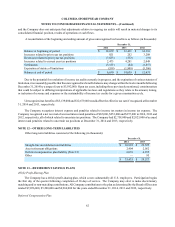
The following table presents the weighted average assumptions for the years ended December 31:
2014 2013 2012
Vesting period 3.83 years 3.84 years 3.86 years
Expected dividend yield 1.33% 1.58% 1.77%
Estimated average fair value per restricted stock unit granted $38.98 $26.67 $23.29
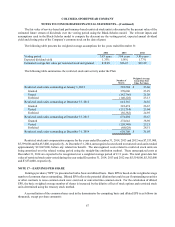
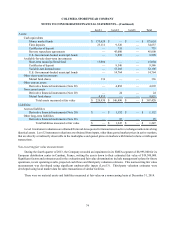
The following table summarizes the restricted stock unit activity under the Plan:
Number of
Shares
Weighted Average
Grant Date Fair
Value Per Share
Restricted stock units outstanding at January 1, 2012 593,504 $ 23.60
Granted 370,606 23.29
Vested (182,766) 21.20
Forfeited (140,228) 23.13
Restricted stock units outstanding at December 31, 2012 641,116 24.16
Granted 322,474 26.67
Vested (232,714) 23.04
Forfeited (56,382) 24.95
Restricted stock units outstanding at December 31, 2013 674,494 25.67
Granted 272,642 38.98
Vested (220,348) 25.21
Forfeited (68,028) 28.51
Restricted stock units outstanding at December 31, 2014 658,760 $ 31.03
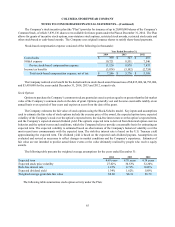
Restricted stock unit compensation expense for the years ended December 31, 2014, 2013 and 2012 was $7,533,000,
$5,399,000 and $4,653,000, respectively. At December 31, 2014, unrecognized costs related to restricted stock units totaled
approximately $13,047,000, before any related tax benefit. The unrecognized costs related to restricted stock units are
being amortized over the related vesting period using the straight-line attribution method. These unrecognized costs at
December 31, 2014 are expected to be recognized over a weighted average period of 2.11 years. The total grant date fair
value of restricted stock units vested during the year ended December 31, 2014, 2013 and 2012 was $5,554,000, $5,362,000
and $3,874,000, respectively.
NOTE 17—EARNINGS PER SHARE
Earnings per share (“EPS”) is presented on both a basic and diluted basis. Basic EPS is based on the weighted average
number of common shares outstanding. Diluted EPS reflects the potential dilution that could occur if outstanding securities
or other contracts to issue common stock were exercised or converted into common stock. For the calculation of diluted
EPS, the basic weighted average number of shares is increased by the dilutive effect of stock options and restricted stock
units determined using the treasury stock method.
A reconciliation of the common shares used in the denominator for computing basic and diluted EPS is as follows (in
thousands, except per share amounts):