Columbia Sportswear 2014 Annual Report Download - page 40
Download and view the complete annual report
Please find page 40 of the 2014 Columbia Sportswear annual report below. You can navigate through the pages in the report by either clicking on the pages listed below, or by using the keyword search tool below to find specific information within the annual report.-
 1
1 -
2
-
3
-
4
-
5
-
6
-
7
-
8
-
9
-
10
-
11
-
12
-
13
-
14
-
15
-
16
-
17
-
18
-
19
-
20
-
21
-
22
-
23
-
24
-
25
-
26
-
27
-
28
-
29
-
 30
30 -
 31
31 -
 32
32 -
 33
33 -
 34
34 -
 35
35 -
 36
36 -
 37
37 -
 38
38 -
 39
39 -
 40
40 -
 41
41 -
 42
42 -
 43
43 -
 44
44 -
 45
45 -
 46
46 -
 47
47 -
 48
48 -
 49
49 -
 50
50 -
51
-
52
-
53
-
54
-
55
-
56
-
57
-
58
-
59
-
60
-
61
-
62
-
63
-
64
-
65
-
66
-
67
-
68
-
69
-
70
-
71
-
72
-
73
-
74
-
75
-
76
-
77
-
78
-
79
-
80
-
81
-
82
-
83
-
84
-
85
-
86
-
87
-
88
-
89
-
90
 |
 |

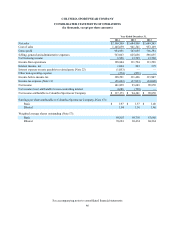
36
Year Ended December 31,
2013 2012 % Change
(In millions, except for percentage changes)
Columbia $ 1,412.9 $ 1,391.1 2%
Mountain Hardwear 132.5 141.5 (6)%
Sorel 128.7 127.0 1%
Other 10.9 10.0 9%
$ 1,685.0 $ 1,669.6 1%
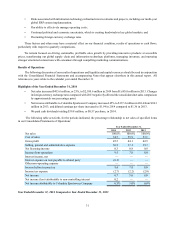
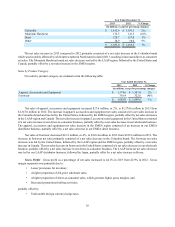
The net sales increase in 2013 compared to 2012 primarily consisted of a net sales increase in the Columbia brand
which was favorably affected by cold winter weather in North America late in 2013, resulting in increased direct-to-consumer
net sales. The Mountain Hardwear brand net sales decrease was led by the LAAP region, followed by the United States and
Canada, partially offset by a net sales increase in the EMEA region.
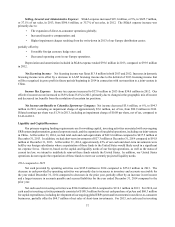
Sales by Product Category
Net sales by product category are summarized in the following table:
Year Ended December 31,
2013 2012 % Change
(In millions, except for percentage changes)
Apparel, Accessories and Equipment $ 1,374.6 $ 1,347.0 2%
Footwear 310.4 322.6 (4)%
$ 1,685.0 $ 1,669.6 1%
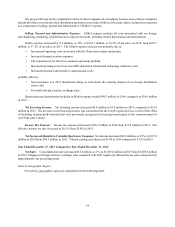
Net sales of apparel, accessories and equipment increased $27.6 million, or 2%, to $1,374.6 million in 2013 from
$1,347.0 million in 2012. The increase in apparel, accessories and equipment net sales consisted of a net sales increase in
the Columbia brand and was led by the United States, followed by the EMEA region, partially offset by net sales decreases
in the LAAP region and Canada. The net sales increase in apparel, accessories and equipment in the United States consisted
of a net sales increase in our direct-to-consumer business, partially offset by a net sales decrease in our wholesale business.
The apparel, accessories and equipment net sales increase in the EMEA region consisted of an increase in our EMEA
distributor business, partially offset by a net sales decrease in our EMEA direct business.
Net sales of footwear decreased $12.2 million, or 4%, to $310.4 million in 2013 from $322.6 million in 2012. The
decrease in footwear net sales primarily consisted of a net sales decrease in the Columbia brand. The footwear net sales
decrease was led by the United States, followed by the LAAP region and the EMEA region, partially offset by a net sales
increase in Canada. The net sales decrease in footwear in the United States consisted of a net sales decrease in our wholesale
business, partially offset by a net sales increase in our direct-to-consumer business. The LAAP footwear net sales decrease
was led by our LAAP distributor business, followed by Japan, partially offset by a net sales increase in Korea.
Gross Profit: Gross profit as a percentage of net sales increased to 44.1% in 2013 from 42.9% in 2012. Gross
margin expansion was primarily due to:
• Lower provisions for inventory;
• A higher proportion of full-price wholesale sales;
• A higher proportion of direct-to-consumer sales, which generate higher gross margins; and
• Decreased promotional selling activities;
partially offset by:
• Unfavorable foreign currency hedge rates.