Cisco 2002 Annual Report Download - page 48
Download and view the complete annual report
Please find page 48 of the 2002 Cisco annual report below. You can navigate through the pages in the report by either clicking on the pages listed below, or by using the keyword search tool below to find specific information within the annual report.-
 1
1 -
2
-
3
-
4
-
5
-
6
-
7
-
8
-
9
-
10
-
11
-
12
-
13
-
14
-
15
-
16
-
17
-
18
-
19
-
20
-
21
-
22
-
23
-
24
-
25
-
26
-
27
-
28
-
29
-
30
-
31
-
32
-
33
-
34
-
35
-
36
-
37
-
 38
38 -
 39
39 -
 40
40 -
 41
41 -
 42
42 -
 43
43 -
 44
44 -
 45
45 -
 46
46 -
 47
47 -
 48
48 -
 49
49 -
 50
50 -
 51
51 -
 52
52 -
 53
53 -
 54
54
 |
 |

Notes to Consolidated Financial Statements
46 Cisco Systems, Inc. 2002 Annual Report
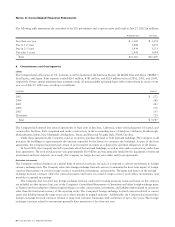
12. Segment Information and Major Customers
The Company’s operations involve the design, development, manufacturing, marketing, and technical support of networking and
communications products and services. Cisco products include routers, switches, access, and other networking equipment. These
products, integrated by the Cisco IOS®Software, link geographically dispersed LANs and WANs into networks.
The Company conducts business globally and is managed geographically. The Company’s management relies on an internal
management system that provides sales and standard cost information by geographic theater. Sales are attributed to a theater based
on the ordering location of the customer. The Company’s management makes financial decisions and allocates resources based on
the information it receives from this internal management system. The Company does not allocate research and development, sales
and marketing, or general and administrative expenses to its geographic theaters in this internal management system, as management
does not use the information to measure the performance of the operating segments. Management does not believe that allocating
these expenses is significant in evaluating a geographic theater’s performance. Based on established criteria, the Company has four
reportable segments: the Americas; EMEA; Asia Pacific; and Japan.
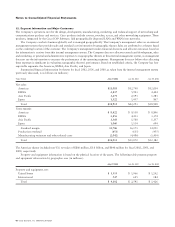
Summarized financial information by theater for fiscal 2002, 2001, and 2000, as taken from the internal management system
previously discussed, is as follows (in millions):
Years Ended July 27, 2002 July 28, 2001 July 29, 2000
Net sales:
Americas $11,083 $12,740 $12,034
EMEA 4,837 5,903 4,444
Asia Pacific 1,673 2,193 1,583
Japan 1,322 1,457 867
Total $18,915 $22,293 $18,928
Gross margin:
Americas $ 8,422 $ 9,118 $ 8,846
EMEA 3,856 4,413 3,374
Asia Pacific 1,368 1,508 1,137
Japan 1,060 1,134 694
Standard margin 14,706 16,173 14,051
Production overhead (651) (615) (455)
Manufacturing variances and other related costs (2,042) (4,486) (1,414)
Total $12,013 $11,072 $12,182
The Americas theater included non-U.S. net sales of $886 million, $1.0 billion, and $848 million for fiscal 2002, 2001, and
2000, respectively.
Property and equipment information is based on the physical location of the assets. The following table presents property
and equipment information by geographic area (in millions):
July 27, 2002 July 28, 2001 July 29, 2000
Property and equipment, net:
United States $ 3,555 $ 1,966 $ 1,242
International 547 625 184
Total $ 4,102 $ 2,591 $ 1,426