Cisco 2002 Annual Report Download - page 15
Download and view the complete annual report
Please find page 15 of the 2002 Cisco annual report below. You can navigate through the pages in the report by either clicking on the pages listed below, or by using the keyword search tool below to find specific information within the annual report.-
 1
1 -
2
-
3
-
4
-
 5
5 -
 6
6 -
 7
7 -
 8
8 -
 9
9 -
 10
10 -
 11
11 -
 12
12 -
 13
13 -
 14
14 -
 15
15 -
 16
16 -
 17
17 -
 18
18 -
 19
19 -
 20
20 -
 21
21 -
 22
22 -
 23
23 -
 24
24 -
 25
25 -
26
-
27
-
28
-
29
-
30
-
31
-
32
-
33
-
34
-
35
-
36
-
37
-
38
-
39
-
40
-
41
-
42
-
43
-
44
-
45
-
46
-
47
-
48
-
49
-
50
-
51
-
52
-
53
-
54
 |
 |

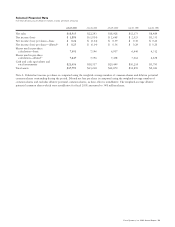
Selected Financial Data
Five Years Ended July 27, 2002 (In millions, except per-share amounts)
Cisco Systems, Inc. 2002 Annual Report 13
July 27, 2002 July 28, 2001 July 29, 2000 July 31, 1999 July 25, 1998
Net sales $18,915 $22,293 $18,928 $12,173 $8,489
Net income (loss) $ 1,893 $ (1,014) $ 2,668 $ 2,023 $1,331
Net income (loss) per share—basic $ 0.26 $ (0.14) $ 0.39 $ 0.30 $ 0.21
Net income (loss) per share—diluted(1) $ 0.25 $ (0.14) $ 0.36 $ 0.29 $ 0.20
Shares used in per-share
calculation—basic 7,301 7,196 6,917 6,646 6,312
Shares used in per-share
calculation—diluted(1) 7,447 7,196 7,438 7,062 6,658
Cash and cash equivalents and
total investments $21,456 $18,517 $20,499 $10,214 $5,793
Total assets $37,795 $35,238 $32,870 $14,893 $9,043
Note 1: Diluted net income per share is computed using the weighted-average number of common shares and dilutive potential
common shares outstanding during the period. Diluted net loss per share is computed using the weighted-average number of
common shares and excludes dilutive potential common shares, as their effect is antidilutive. The weighted-average dilutive
potential common shares which were antidilutive for fiscal 2001 amounted to 348 million shares.