Cisco 2002 Annual Report Download - page 25
Download and view the complete annual report
Please find page 25 of the 2002 Cisco annual report below. You can navigate through the pages in the report by either clicking on the pages listed below, or by using the keyword search tool below to find specific information within the annual report.-
 1
1 -
2
-
3
-
4
-
5
-
6
-
7
-
8
-
9
-
10
-
11
-
12
-
13
-
14
-
 15
15 -
 16
16 -
 17
17 -
 18
18 -
 19
19 -
 20
20 -
 21
21 -
 22
22 -
 23
23 -
 24
24 -
 25
25 -
 26
26 -
 27
27 -
 28
28 -
 29
29 -
 30
30 -
 31
31 -
 32
32 -
 33
33 -
 34
34 -
 35
35 -
36
-
37
-
38
-
39
-
40
-
41
-
42
-
43
-
44
-
45
-
46
-
47
-
48
-
49
-
50
-
51
-
52
-
53
-
54
 |
 |

Quantitative and Qualitative Disclosures about Market Risk
Cisco Systems, Inc. 2002 Annual Report 23
We maintain an investment portfolio of various holdings, types, and maturities. These securities are generally classified as available
for sale and, consequently, are recorded on the Consolidated Balance Sheets at fair value with unrealized gains or losses reported
as a separate component of accumulated other comprehensive income (loss), net of tax. Part of this portfolio includes equity
investments in several publicly traded companies, the values of which are subject to market price volatility. During fiscal 2002,
the net change in unrealized gains and losses on investments included as a separate component of comprehensive income was
$224 million primarily due to the recognition of a charge of $858 million, pre-tax, in the first quarter attributable to the impairment
of certain publicly traded equity securities, partially offset by a net decrease of approximately $500 million in the fair value of
investments (see Note 9 to the Consolidated Financial Statements). The impairment charge was related to the decline in the fair
value of our publicly traded equity investments below their cost basis that was judged to be other-than-temporary.
At any time, a rise in interest rates could have a material adverse impact on the fair value of our investment portfolio. Conversely,
declines in interest rates could have a material impact on interest earnings of our investment portfolio. We do not currently hedge
these interest rate exposures.
We have also invested in several privately held companies, many of which can still be considered in the start-up or development
stages. These investments are inherently risky as the markets for the technologies or products they have under development are typically
in the early stages and may never materialize. We could lose our entire initial investment in these companies. As of July 27, 2002,
these investments decreased to $477 million from $775 million at July 28, 2001 primarily due to additional provisions for losses.
Investments
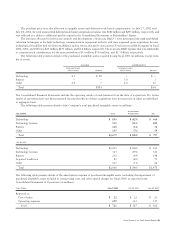
The following table presents the hypothetical changes in fair value of the financial instruments held at July 27, 2002 that are
sensitive to changes in interest rates (in millions):
VALUATION OF SECURITIES FAIR VALUE VALUATION OF SECURITIES
GIVEN AN INTEREST RATE AS OF GIVEN AN INTEREST RATE
DECREASE OF X BASIS POINTS JULY 27, INCREASE OF X BASIS POINTS
Issuer (150 BPS) (100 BPS) (50 BPS) 2002 50 BPS 100 BPS 150 BPS
U.S. government notes and bonds $ 4,637 $ 4,580 $ 4,524 $ 4,467 $ 4,410 $ 4,353 $ 4,297
Corporate notes and bonds 7,178 7,098 7,018 6,938 6,859 6,779 6,699
Total $11,815 $11,678 $11,542 $11,405 $11,269 $11,132 $10,996
These instruments are not leveraged and are held for purposes other than trading. The modeling technique used measures the change
in fair value arising from selected potential changes in interest rates. Market changes reflect immediate hypothetical parallel shifts
in the yield curve of plus or minus 50 basis points (“BPS”), 100 BPS, and 150 BPS, which are representative of the historical
movements in the Federal Funds Rate.
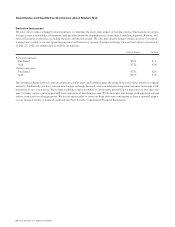
The following table presents the hypothetical changes in fair value of public equity investments that are sensitive to changes
in the stock market (in millions):
VALUATION OF SECURITIES FAIR VALUE VALUATION OF SECURITIES
GIVEN X% DECREASE AS OF GIVEN X% INCREASE
IN EACH STOCK’S PRICE JULY 27, IN EACH STOCK’S PRICE
(75%) (50%) (25%) 2002 25% 50% 75%
Corporate equity securities $142 $284 $425 $567 $709 $851 $992
Our equity portfolio consists of securities with characteristics that most closely match the S&P Index or companies traded on the
Nasdaq National Market. These equity securities are held for purposes other than trading. The modeling technique used measures
the hypothetical change in fair value arising from selected hypothetical changes in each stock’s price. Stock price fluctuations of plus
or minus 25%, 50%, and 75% were selected based on the probability of their occurrence and are representative of the historical
movements in the Nasdaq Composite Index.