Cisco 2002 Annual Report Download - page 17
Download and view the complete annual report
Please find page 17 of the 2002 Cisco annual report below. You can navigate through the pages in the report by either clicking on the pages listed below, or by using the keyword search tool below to find specific information within the annual report.-
 1
1 -
2
-
3
-
4
-
5
-
6
-
 7
7 -
 8
8 -
 9
9 -
 10
10 -
 11
11 -
 12
12 -
 13
13 -
 14
14 -
 15
15 -
 16
16 -
 17
17 -
 18
18 -
 19
19 -
 20
20 -
 21
21 -
 22
22 -
 23
23 -
 24
24 -
 25
25 -
 26
26 -
 27
27 -
28
-
29
-
30
-
31
-
32
-
33
-
34
-
35
-
36
-
37
-
38
-
39
-
40
-
41
-
42
-
43
-
44
-
45
-
46
-
47
-
48
-
49
-
50
-
51
-
52
-
53
-
54
 |
 |

Cisco Systems, Inc. 2002 Annual Report 15
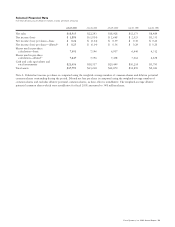
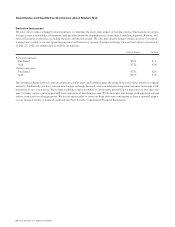
Comparison of Fiscal 2002 and 2001
Net Sales
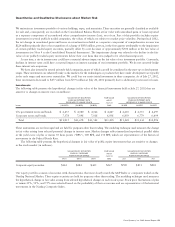
We manage our business based on four geographic theaters: the Americas; Europe, the Middle East, and Africa (“EMEA”); Asia
Pacific; and Japan. Net sales, which include product and service revenue, for each theater are summarized in the following table
(in millions, except percentages):
AMOUNT PERCENTAGE OF NET SALES
Years Ended July 27, 2002 July 28, 2001 July 27, 2002 July 28, 2001
Net sales:
Americas $11,083 $ 12,740 58.6% 57.2%
EMEA 4,837 5,903 25.6% 26.5%
Asia Pacific 1,673 2,193 8.8% 9.8%
Japan 1,322 1,457 7.0% 6.5%
Total $18,915 $ 22,293 100.0% 100.0%
Net sales in fiscal 2002 decreased by $3.4 billion or 15.2% from $22.3 billion in fiscal 2001 to $18.9 billion. The decrease was
primarily related to a decline in net product sales resulting from unfavorable global economic conditions and reduced levels of
information technology-related capital spending compared with a year ago. The economic slowdown has had a significant impact
on the telecommunications industry.
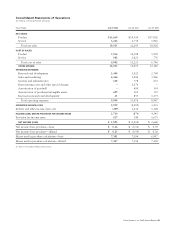
Product Revenue
From a geographic perspective, net product sales in the Americas theater, which include the United States, Canada, Mexico, and
Latin America, decreased by $1.7 billion or 17.3% from $10.0 billion in fiscal 2001 to $8.3 billion in fiscal 2002 and represented
52.8% of our total product sales. The decrease was primarily related to the decline in net product sales in the service provider market,
in particular the Incumbent Local Exchange Carriers (ILEC) and Interexchange Carriers (IXC) sectors. The slowdown in the U.S.
economy, over-capacity, changes in the service provider market, and constraints on information technology-related capital spending
have had a significant adverse effect on many of our service provider customers. The enterprise market experienced a lower decrease
in net product sales as compared with the service provider market primarily because of the need for large corporations, specifically
in the manufacturing, health care, education, and retail sectors, and the U.S. government, to maintain their networks.
Net product sales in EMEA in fiscal 2002 decreased by $1.4 billion or 23.1% from $5.9 billion in fiscal 2001 to $4.5 billion and
represented 29.0% of our total product sales. Similar to the Americas theater, the decrease in net product sales was related to the slowdown
in the European telecommunications sector and the enterprise market due to companies closely managing their capital spending.
Net product sales in Asia Pacific in fiscal 2002 decreased by $600 million or 27.4% from $2.2 billion in fiscal 2001 to
$1.6 billion and represented 10.2% of our total product sales. The decrease was primarily related to the decline in net product sales
in the enterprise and service provider markets, in particular the service provider market in China, which experienced increased
consolidation and restructuring.
Net product sales in Japan in fiscal 2002 decreased by $196 million or 13.5% from $1.5 billion in fiscal 2001 to $1.3 billion and
represented the remaining 8.0% of our total product sales. The decrease was primarily related to contractions in the electronics sector
partially offset by net product sales to the government sector.
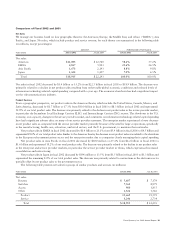
The following table presents net sales for groups of similar products and services (in millions):
Years Ended July 27, 2002 July 28, 2001
Net sales:
Routers $ 5,607 $ 7,179
Switches 7,560 8,979
Access 980 1,855
Other 1,522 1,546
Product 15,669 19,559
Service 3,246 2,734
Total $ 18,915 $ 22,293