Cisco 2002 Annual Report Download - page 35
Download and view the complete annual report
Please find page 35 of the 2002 Cisco annual report below. You can navigate through the pages in the report by either clicking on the pages listed below, or by using the keyword search tool below to find specific information within the annual report.
Cisco Systems, Inc. 2002 Annual Report 33
The purchase price was also allocated to tangible assets and deferred stock-based compensation. At July 27, 2002 and
July 28, 2001, the total unamortized deferred stock-based compensation balance was $182 million and $293 million, respectively, and
was reflected as a debit to additional paid-in capital in the Consolidated Statements of Shareholders’ Equity.
The amounts allocated to in-process research and development (“in-process R&D”) were determined through established
valuation techniques in the high-technology communications equipment industry and were expensed upon acquisition because
technological feasibility had not been established and no future alternative uses existed. Total in-process R&D expense in fiscal
2002, 2001, and 2000 was $65 million, $855 million, and $1.4 billion, respectively. The in-process R&D expense that was attributable
to common stock consideration for the same periods was $53 million, $739 million, and $1.3 billion, respectively.
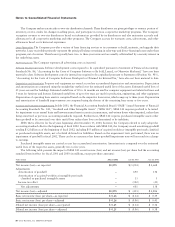
The following table presents details of the purchased intangible assets acquired during fiscal 2002 (in millions, except num-
ber of years):
ALLEGRO AURORANETICS
Estimated Useful Estimated Useful
Life (in Years) Amount Life (in Years) Amount
Technology 4.1 $ 98 –$–
Patents – – 5.0 3
Other 2.0 7 2.0 11
Total $105 $ 14
The Consolidated Financial Statements include the operating results of each business from the date of acquisition. Pro forma
results of operations have not been presented because the effects of these acquisitions were not material on either an individual
or aggregate basis.
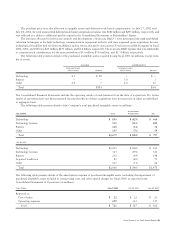
The following tables present details of the Company’s total purchased intangible assets (in millions):
Accumulated
July 27, 2002 Gross Amortization Net
Technology $ 893 $ (429) $ 464
Technology licenses 523 (323) 200
Patents 128 (54) 74
Other 135 (76) 59
Total $1,679 $ (882) $ 797
July 28, 2001
Technology $1,053 $ (240) $ 813
Technology licenses 523 (191) 332
Patents 232 (44) 188
Acquired workforce 91 (20) 71
Other 117 (51) 66
Total $2,016 $ (546) $1,470
The following table presents details of the amortization expense of purchased intangible assets (excluding the impairment of
purchased intangible assets included in restructuring costs and other special charges for fiscal 2001) as reported in the
Consolidated Statements of Operations (in millions):
Years Ended July 27, 2002 July 28, 2001 July 29, 2000
Reported as:
Cost of sales $22 $22 $ 25
Operating expenses 699 365 137
Total $ 721 $ 387 $ 162


