Cisco 2002 Annual Report Download - page 22
Download and view the complete annual report
Please find page 22 of the 2002 Cisco annual report below. You can navigate through the pages in the report by either clicking on the pages listed below, or by using the keyword search tool below to find specific information within the annual report.-
 1
1 -
2
-
3
-
4
-
5
-
6
-
7
-
8
-
9
-
10
-
11
-
 12
12 -
 13
13 -
 14
14 -
 15
15 -
 16
16 -
 17
17 -
 18
18 -
 19
19 -
 20
20 -
 21
21 -
 22
22 -
 23
23 -
 24
24 -
 25
25 -
 26
26 -
 27
27 -
 28
28 -
 29
29 -
 30
30 -
 31
31 -
 32
32 -
33
-
34
-
35
-
36
-
37
-
38
-
39
-
40
-
41
-
42
-
43
-
44
-
45
-
46
-
47
-
48
-
49
-
50
-
51
-
52
-
53
-
54
 |
 |

Management’s Discussion and Analysis of Financial Condition and Results of Operations
20 Cisco Systems, Inc. 2002 Annual Report
Provision for Income Taxes
The effective tax rate was 30.1% for fiscal 2002 and (16.0%) for fiscal 2001. The effective tax rate differs from the statutory rate
primarily due to the impact of nondeductible in-process R&D, acquisition-related costs, research and experimentation tax credits,
state taxes, and the tax impact of non-U.S. operations.
Our future effective tax rates could be adversely affected by earnings being lower than anticipated in countries where we have
lower statutory rates, changes in the valuation of our deferred tax assets or liabilities, or changes in tax laws or interpretations
thereof. In addition, we are subject to the examination of our income tax returns by the Internal Revenue Service and other tax
authorities. We regularly assess the likelihood of adverse outcomes resulting from these examinations to determine the adequacy
of our provision for income taxes.
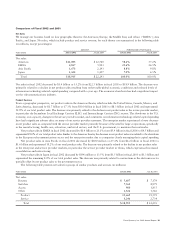
Comparison of Fiscal 2001 and 2000
Net product revenue in fiscal 2001 was $19.6 billion, compared with $17.0 billion in fiscal 2000, an increase of 15.0%. The
increase in net product revenue was primarily a result of increased unit sales of router and switch products, growth in the sales
of add-on boards that provide increased functionality, and optical transport products.
Net service revenue in fiscal 2001 was $2.7 billion, compared with $1.9 billion in fiscal 2000, an increase of 42.0%. The
increase in net service revenue was primarily related to an increase in product sales and installed base of equipment needing
maintenance support.
Gross margin in fiscal 2001 was 49.7%, compared with 64.4% in fiscal 2000. The decrease in the gross margin was primarily
due to an additional excess inventory charge that was recorded in the third quarter of fiscal 2001, as previously discussed.
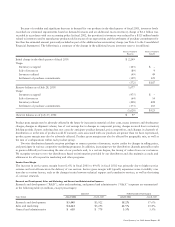
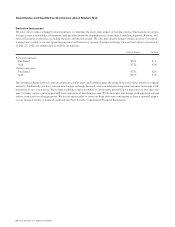
R&D, sales and marketing, and G&A expenses are summarized in the following table (in millions, except percentages):
AMOUNT PERCENTAGE OF NET SALES
Years Ended July 28, 2001 July 29, 2000 July 28, 2001 July 29, 2000
Research and development $3,922 $2,704 17.6% 14.3%
Sales and marketing $5,296 $3,946 23.8% 20.8%
General and administrative $ 778 $ 633 3.5% 3.3%
The increase in R&D, sales and marketing, and G&A expenses compared with fiscal 2000 was consistent with our overall
increase in net sales during the first half of fiscal 2001. R&D, sales and marketing, and G&A expenses as a percentage of net
sales for fiscal 2001 increased compared with the prior fiscal year primarily due to a decline in net sales during the second half
of fiscal 2001.
R&D expenses in fiscal 2001 increased by 45.0% from fiscal 2000. The increase reflected our R&D efforts in a wide variety
of areas. A significant portion of the increase was due to the addition of new personnel, partly through acquisitions, as well as
higher expenditures on prototypes and depreciation on additional lab equipment.
Sales and marketing expenses in fiscal 2001 increased by 34.2% from fiscal 2000. The increase in sales and marketing expenses
was primarily due to an increase in the size of our direct sales force and related commissions, additional marketing and advertising
investments associated with existing and new product introductions, the expansion of distribution channels and markets, and
general corporate branding.
G&A expenses in fiscal 2001 increased by 22.9% from fiscal 2000. The increase in G&A expenses was primarily related to
the addition of new personnel and investments in infrastructure.
During fiscal 2001, we recorded restructuring costs and other special charges of $1.2 billion and an additional excess
inventory charge of $2.2 billion. For additional information regarding the restructuring program, see Note 4 to the Consolidated
Financial Statements.
Amortization of goodwill was $690 million in fiscal 2001, compared with $154 million in fiscal 2000. Amortization of purchased
intangible assets included in operating expenses was $365 million in fiscal 2001, compared with $137 million in fiscal 2000.
Amortization of goodwill and purchased intangible assets increased as we acquired companies and technologies.
Interest and other income (loss), net, was $1.1 billion in both fiscal 2001 and 2000. Interest income increased in fiscal 2001
to $967 million, compared with $615 million in fiscal 2000. The increase in interest income was primarily related to the general
increase in cash and investments generated from our operations. Other income (loss) decreased in fiscal 2001 to $163 million,
compared with $493 million in fiscal 2000. The decrease in other income (loss) was primarily related to lower net realized gains
on investments.
The effective tax rate was (16.0%) for fiscal 2001 and 38.6% for fiscal 2000. The effective tax rate differs from the statutory
rate primarily due to the impact of nondeductible in-process R&D, acquisition-related costs, research and experimentation tax credits,
state taxes, and the tax impact of non-U.S. operations.