Cisco 2002 Annual Report Download - page 18
Download and view the complete annual report
Please find page 18 of the 2002 Cisco annual report below. You can navigate through the pages in the report by either clicking on the pages listed below, or by using the keyword search tool below to find specific information within the annual report.-
 1
1 -
2
-
3
-
4
-
5
-
6
-
7
-
 8
8 -
 9
9 -
 10
10 -
 11
11 -
 12
12 -
 13
13 -
 14
14 -
 15
15 -
 16
16 -
 17
17 -
 18
18 -
 19
19 -
 20
20 -
 21
21 -
 22
22 -
 23
23 -
 24
24 -
 25
25 -
 26
26 -
 27
27 -
 28
28 -
29
-
30
-
31
-
32
-
33
-
34
-
35
-
36
-
37
-
38
-
39
-
40
-
41
-
42
-
43
-
44
-
45
-
46
-
47
-
48
-
49
-
50
-
51
-
52
-
53
-
54
 |
 |

Management’s Discussion and Analysis of Financial Condition and Results of Operations
16 Cisco Systems, Inc. 2002 Annual Report
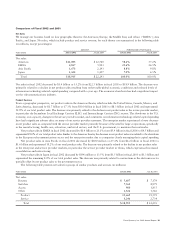
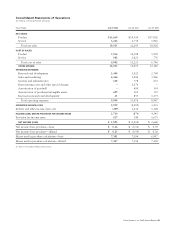
Net product sales related to routers, which represented 35.8% of our total product sales in fiscal 2002, decreased by $1.6 billion
or 21.9% from $7.2 billion in fiscal 2001 to $5.6 billion primarily due to decreases in sales of our high-end and edge routers.
Net product sales related to switches, which represented 48.2% of our total product sales in fiscal 2002, experienced a decrease
of $1.4 billion or 15.8% from $9.0 billion in fiscal 2001 to $7.6 billion primarily due to decreases in sales of our modular and WAN
multiservice switches. Net product sales related to access products, which represented 6.3% of our total product sales in fiscal 2002,
decreased by $875 million or 47.2% from $1.9 billion in fiscal 2001 to $980 million primarily related to decreases in sales of our
access concentrators and digital subscriber line access multiplexer (DSLAM) products.
Service Revenue
Net service revenue in fiscal 2002 increased by $512 million or 18.7% from $2.7 billion in fiscal 2001 to $3.2 billion. The increase in
net service revenue was primarily related to technical support, which provides maintenance and problem resolution services for our
products. In addition, revenue from consultative support of our technologies for specific customer networking needs increased. During
fiscal 2002, service contract renewals associated with product sales increased compared with the prior fiscal year. Net service revenue is
generally deferred and, in most cases, recognized ratably over the service period obligations, which are typically one to three years.
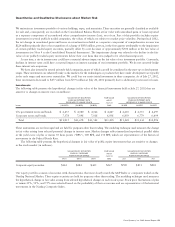
Gross Margin
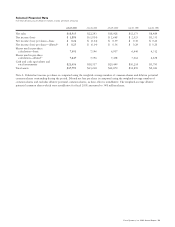
The following table shows the standard margin for each theater and the total gross margin (in millions, except percentages):
AMOUNT STANDARD MARGIN
Years Ended July 27, 2002 July 28, 2001 July 27, 2002 July 28, 2001
Gross margin:
Americas $ 8,422 $ 9,118 76.0% 71.6%
EMEA 3,856 4,413 79.7% 74.8%
Asia Pacific 1,368 1,508 81.8% 68.8%
Japan 1,060 1,134 80.2% 77.8%
Standard margin 14,706 16,173 77.7% 72.5%
Production overhead (651) (615)
Manufacturing variances and
other related costs (2,042) (4,486)
Total $ 12,013 $ 11,072
Standard margin varies due to a number of reasons including, but not limited to, shifts in product mix, sales discounts, and sales channels.
Production overhead is primarily related to labor, depreciation on equipment, and facilities charges associated with manufacturing
activities. Manufacturing variances and other related costs are primarily related to provision for inventory, which included the
additional excess inventory charge of $2.2 billion in fiscal 2001 as discussed below, as well as freight and other nonstandard costs.
Gross margin for product and service in fiscal 2002 and 2001 was as follows (in millions, except percentages):
AMOUNT PERCENTAGE
Years Ended July 27, 2002 July 28, 2001 July 27, 2002 July 28, 2001
Gross margin:
Product $ 9,755 $ 9,361 62.3% 47.9%
Service 2,258 1,711 69.6% 62.6%
Total $ 12,013 $ 11,072 63.5% 49.7%
Product Gross Margin
The increase in product gross margin from 47.9% in fiscal 2001 to 62.3% in fiscal 2002 was primarily related to the effect of a
charge for additional excess inventory of $2.2 billion recorded in the third quarter of fiscal 2001 and benefits recognized thereafter
as described below. Excluding the additional excess inventory charge and the subsequent benefits, product gross margin was 58.9%
in fiscal 2002, compared with 58.4% in fiscal 2001. The slight increase in product gross margin of 0.5% was primarily due to
lower component costs that were partially offset by lower shipment volumes.