Cisco 2002 Annual Report Download - page 4
Download and view the complete annual report
Please find page 4 of the 2002 Cisco annual report below. You can navigate through the pages in the report by either clicking on the pages listed below, or by using the keyword search tool below to find specific information within the annual report.-
 1
1 -
 2
2 -
 3
3 -
 4
4 -
 5
5 -
 6
6 -
 7
7 -
 8
8 -
 9
9 -
 10
10 -
 11
11 -
 12
12 -
 13
13 -
 14
14 -
 15
15 -
16
-
17
-
18
-
19
-
20
-
21
-
22
-
23
-
24
-
25
-
26
-
27
-
28
-
29
-
30
-
31
-
32
-
33
-
34
-
35
-
36
-
37
-
38
-
39
-
40
-
41
-
42
-
43
-
44
-
45
-
46
-
47
-
48
-
49
-
50
-
51
-
52
-
53
-
54
 |
 |

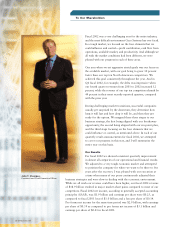
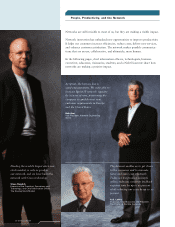
To Our Shareholders
2www.cisco.com
John T. Chambers
President and Chief Executive Officer
Fiscal 2002 was a very challenging year for the entire industry,
and the most difficult environment Cisco Systems has ever faced.
In a tough market, we focused on the four elements that we
could influence and control—profit contribution, cash flow from
operations, available market, and productivity. And although we
all wish the market conditions had been different, we were
pleased with our progress in each of these areas.
One area where we set aggressive stretch goals was our focus on
the available market, with our goal being to grow 10 percent
faster than our top ten North American competitors. We
achieved this goal consistently throughout the year. And in
Q4 fiscal 2002, for example, the delta was impressive when
our fourth quarter revenues from 2001 to 2002 increased 12
percent, while the revenue of our top ten competitors shrunk by
44 percent in their most recently reported quarters, compared
with the prior year.
During challenging market transitions, successful companies
usually get surprised by the downturn, they determine how
long it will last and how deep it will be, and then they get
ready for the upturn. We mapped these three stages to our
business strategy, the first being aligned with our breakaway
opportunity, the second being aligned with our six-point plan,
and the third stage focusing on the four elements that we
could influence or control, as mentioned above. In each of our
quarterly result announcements for fiscal 2002, we attempted
to cover our progress in this way, and I will summarize the
entire year on this basis.
Our Results
For fiscal 2002 we showed consistent quarterly improvement
in almost all categories of our operational and financial results.
We adjusted to a very tough economic market and attempted
to position the company for where we want to be three to five
years after the recovery. I was pleased with our execution at
a time when many of our peers continuously adjusted their
business strategies and were slow in dealing with the economic environment.
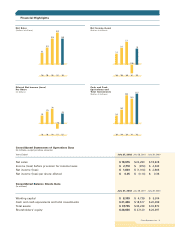
While we all wish our revenue could have been higher, our fiscal 2002 revenue
of $18.9 billion resulted in major market-share gains compared to most of our
competitors. Fiscal 2002 net income, according to generally accepted accounting
principles (GAAP), was $1.9 billion and earnings per share were $0.25, as
compared to fiscal 2001 loss of $1.0 billion and a loss per share of $0.14.
Pro forma net income for the same time period was $2.9 billion, with earnings
per share of $0.39 as compared to pro forma net income of $3.1 billion and
earnings per share of $0.41 in fiscal 2001.