Cisco 2002 Annual Report Download - page 19
Download and view the complete annual report
Please find page 19 of the 2002 Cisco annual report below. You can navigate through the pages in the report by either clicking on the pages listed below, or by using the keyword search tool below to find specific information within the annual report.-
 1
1 -
2
-
3
-
4
-
5
-
6
-
7
-
8
-
 9
9 -
 10
10 -
 11
11 -
 12
12 -
 13
13 -
 14
14 -
 15
15 -
 16
16 -
 17
17 -
 18
18 -
 19
19 -
 20
20 -
 21
21 -
 22
22 -
 23
23 -
 24
24 -
 25
25 -
 26
26 -
 27
27 -
 28
28 -
 29
29 -
30
-
31
-
32
-
33
-
34
-
35
-
36
-
37
-
38
-
39
-
40
-
41
-
42
-
43
-
44
-
45
-
46
-
47
-
48
-
49
-
50
-
51
-
52
-
53
-
54
 |
 |

Cisco Systems, Inc. 2002 Annual Report 17
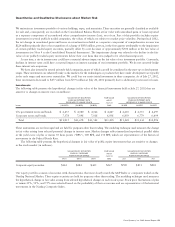
Because of a sudden and significant decrease in demand for our products in the third quarter of fiscal 2001, inventory levels
exceeded our estimated requirements based on demand forecasts and an additional excess inventory charge of $2.2 billion was
recorded in accordance with our accounting policy. In fiscal 2002, the provision for inventory was reduced by a $525 million benefit
related to inventory used to manufacture products sold in excess of our expectations and the settlement of purchase commitments for
less than the estimated amount previously included as part of the additional excess inventory charge (see Note 4 to the Consolidated
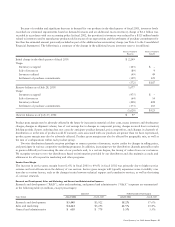
Financial Statements). The following is a summary of the change in the additional excess inventory reserve (in millions):
Excess Inventory Excess Inventory
Reserve Benefit
Initial charge in the third quarter of fiscal 2001 $ 2,249
Usage:
Inventory scrapped (105) $ –
Sale of inventory (89) 9
Inventory utilized (49) 49
Settlement of purchase commitments (329) 129
(572) $ 187
Reserve balance as of July 28, 2001 1,677
Usage:
Inventory scrapped (975) $ –
Sale of inventory (64) 14
Inventory utilized (408) 408
Settlement of purchase commitments (173) 103
(1,620) $ 525
Reserve balance as of July 27, 2002 $57
Product gross margin may be adversely affected in the future by increases in material or labor costs, excess inventory and obsolescence
charges, changes in shipment volume, loss of cost savings due to changes in component pricing, charges incurred due to inventory
holding periods if parts ordering does not correctly anticipate product demand, price competition, and changes in channels of
distribution or in the mix of products sold. If warranty costs associated with our products are greater than we have experienced,
product gross margin may also be adversely affected. Product gross margin may also be affected by geographic mix, as well as
the mix of configurations within each product group.
Two-tier distribution channels are given privileges to return a portion of inventory, receive credits for changes in selling prices,
and participate in various cooperative marketing programs. In addition, increasing two-tier distribution channels generally results
in greater difficulty in forecasting the mix of our products and, to a certain degree, the timing of orders from our customers.
We recognize revenue to two-tier distributors based on information provided by our distributors and also maintain accruals and
allowances for all cooperative marketing and other programs.
Service Gross Margin
The increase in service gross margin from 62.6% in fiscal 2001 to 69.6% in fiscal 2002 was primarily due to higher service
revenue and cost efficiencies in the delivery of our services. Service gross margin will typically experience some variability over
time due to various factors, such as the changes in mix between technical support and consultative services, as well as the timing
of contract renewals.
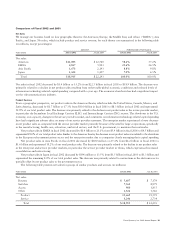
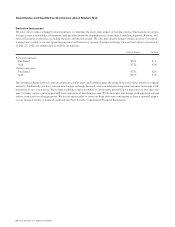
Research and Development, Sales and Marketing, and General and Administrative Expenses
Research and development (“R&D”), sales and marketing, and general and administrative (“G&A”) expenses are summarized
in the following table (in millions, except percentages):
AMOUNT PERCENTAGE OF NET SALES
Years Ended July 27, 2002 July 28, 2001 July 27, 2002 July 28, 2001
Research and development $ 3,448 $3,922 18.2% 17.6%
Sales and marketing $ 4,264 $5,296 22.5% 23.8%
General and administrative $ 618 $ 778 3.3% 3.5%