Cisco 2002 Annual Report Download - page 29
Download and view the complete annual report
Please find page 29 of the 2002 Cisco annual report below. You can navigate through the pages in the report by either clicking on the pages listed below, or by using the keyword search tool below to find specific information within the annual report.-
 1
1 -
2
-
3
-
4
-
5
-
6
-
7
-
8
-
9
-
10
-
11
-
12
-
13
-
14
-
15
-
16
-
17
-
18
-
 19
19 -
 20
20 -
 21
21 -
 22
22 -
 23
23 -
 24
24 -
 25
25 -
 26
26 -
 27
27 -
 28
28 -
 29
29 -
 30
30 -
 31
31 -
 32
32 -
 33
33 -
 34
34 -
 35
35 -
 36
36 -
 37
37 -
 38
38 -
 39
39 -
40
-
41
-
42
-
43
-
44
-
45
-
46
-
47
-
48
-
49
-
50
-
51
-
52
-
53
-
54
 |
 |

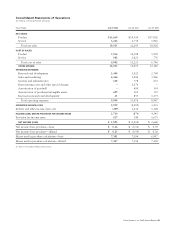
Consolidated Statements of Cash Flows
(In millions)
Years Ended July 27, 2002 July 28, 2001 July 29, 2000
Cash flows from operating activities:
Net income (loss) $ 1,893 $ (1,014) $ 2,668
Adjustments to reconcile net income (loss) to
net cash provided by operating activities:
Depreciation and amortization 1,957 2,236 863
Provision for doubtful accounts 91 268 40
Provision for inventory 149 2,775 339
Deferred income taxes (573) (924) (782)
Tax benefits from employee stock option plans 61 1,397 2,495
Adjustment to conform fiscal year ends of pooled acquisitions –– (18)
In-process research and development 53 739 1,279
Net (gains) losses on investments and provision for losses 1,127 43 (92)
Restructuring costs and other special charges –501 –
Change in operating assets and liabilities:
Accounts receivable 270 569 (1,043)
Inventories 673 (1,644) (887)
Prepaid expenses and other current assets (28) (25) (249)
Accounts payable (174) (105) 286
Income taxes payable 389 (434) (365)
Accrued compensation 307 (256) 576
Deferred revenue 678 1,629 662
Other accrued liabilities (222) 251 369
Restructuring liabilities (64) 386 –
Net cash provided by operating activities 6,587 6,392 6,141
Cash flows from investing activities:
Purchases of short-term investments (5,473) (4,594) (2,473)
Proceeds from sales and maturities of short-term investments 5,868 4,370 2,481
Purchases of investments (15,760) (18,306) (14,778)
Proceeds from sales and maturities of investments 15,317 15,579 13,240
Purchases of restricted investments (291) (941) (458)
Proceeds from sales and maturities of restricted investments 1,471 1,082 206
Acquisition of property and equipment (2,641) (2,271) (1,086)
Purchases of technology licenses –(4) (444)
Acquisition of businesses, net of cash and cash equivalents 16 (13) 24
Change in lease receivables, net 380 457 (535)
Purchases of investments in privately held companies (58) (1,161) (130)
Lease deposits 320 (320) –
Purchase of minority interest of Cisco Systems, K.K. (Japan) (115) (365) –
Other 159 (516) (424)
Net cash used in investing activities (807) (7,003) (4,377)
Cash flows from financing activities:
Issuance of common stock 655 1,262 1,564
Repurchase of common stock (1,854) ––
Other 30 (12) (7)
Net cash (used in) provided by financing activities (1,169) 1,250 1,557
Net increase in cash and cash equivalents 4,611 639 3,321
Cash and cash equivalents, beginning of fiscal year 4,873 4,234 913
Cash and cash equivalents, end of fiscal year $ 9,484 $ 4,873 $ 4,234
See Notes to Consolidated Financial Statements.
Cisco Systems, Inc. 2002 Annual Report 27