CarMax 2004 Annual Report Download - page 40
Download and view the complete annual report
Please find page 40 of the 2004 CarMax annual report below. You can navigate through the pages in the report by either clicking on the pages listed below, or by using the keyword search tool below to find specific information within the annual report.-
 1
1 -
2
-
3
-
4
-
5
-
6
-
7
-
8
-
9
-
10
-
11
-
12
-
13
-
14
-
15
-
16
-
17
-
18
-
19
-
20
-
21
-
22
-
23
-
24
-
25
-
26
-
27
-
28
-
29
-
 30
30 -
 31
31 -
 32
32 -
 33
33 -
 34
34 -
 35
35 -
 36
36 -
 37
37 -
 38
38 -
 39
39 -
 40
40 -
 41
41 -
 42
42 -
 43
43 -
 44
44 -
 45
45 -
 46
46 -
 47
47 -
 48
48 -
 49
49 -
 50
50 -
51
-
52
 |
 |
38
CARMAX
2004
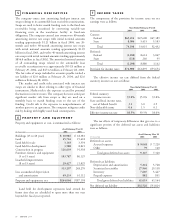
FINANCIAL DERIVATIVES
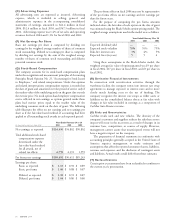
The company enters into amortizing fixed-pay interest rate
swaps relating to its automobile loan receivable securitizations.
Swaps are used to better match funding costs to the fixed-rate
receivables being securitized by converting variable-rate
financing costs in the warehouse facility to fixed-rate
obligations. The company entered into twenty-two 40-month
amortizing interest rate swaps with initial notional amounts
totaling approximately $1.21 billion in fiscal 2004, one 20-
month and twelve 40-month amortizing interest rate swaps
with initial notional amounts totaling approximately $1.05
billion in fiscal 2003, and twelve 40-month amortizing interest
rate swaps with initial notional amounts totaling approximately
$854.0 million in fiscal 2002. The amortized notional amount
of all outstanding swaps related to the automobile loan
receivable securitizations was approximately $551.8 million at
February 29, 2004, and $473.2 million at February 28, 2003.
The fair value of swaps included in accounts payable totaled a
net liability of $2.0 million at February 29, 2004, and $2.6
million at February 28, 2003.
The market and credit risks associated with interest rate
swaps are similar to those relating to other types of financial
instruments. Market risk is the exposure created by potential
fluctuations in interest rates. The company does not anticipate
significant market risk from swaps as they are used on a
monthly basis to match funding costs to the use of the
funding. Credit risk is the exposure to nonperformance of
another party to an agreement. The company mitigates credit
risk by dealing with highly rated bank counterparties.
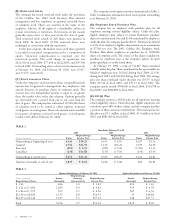
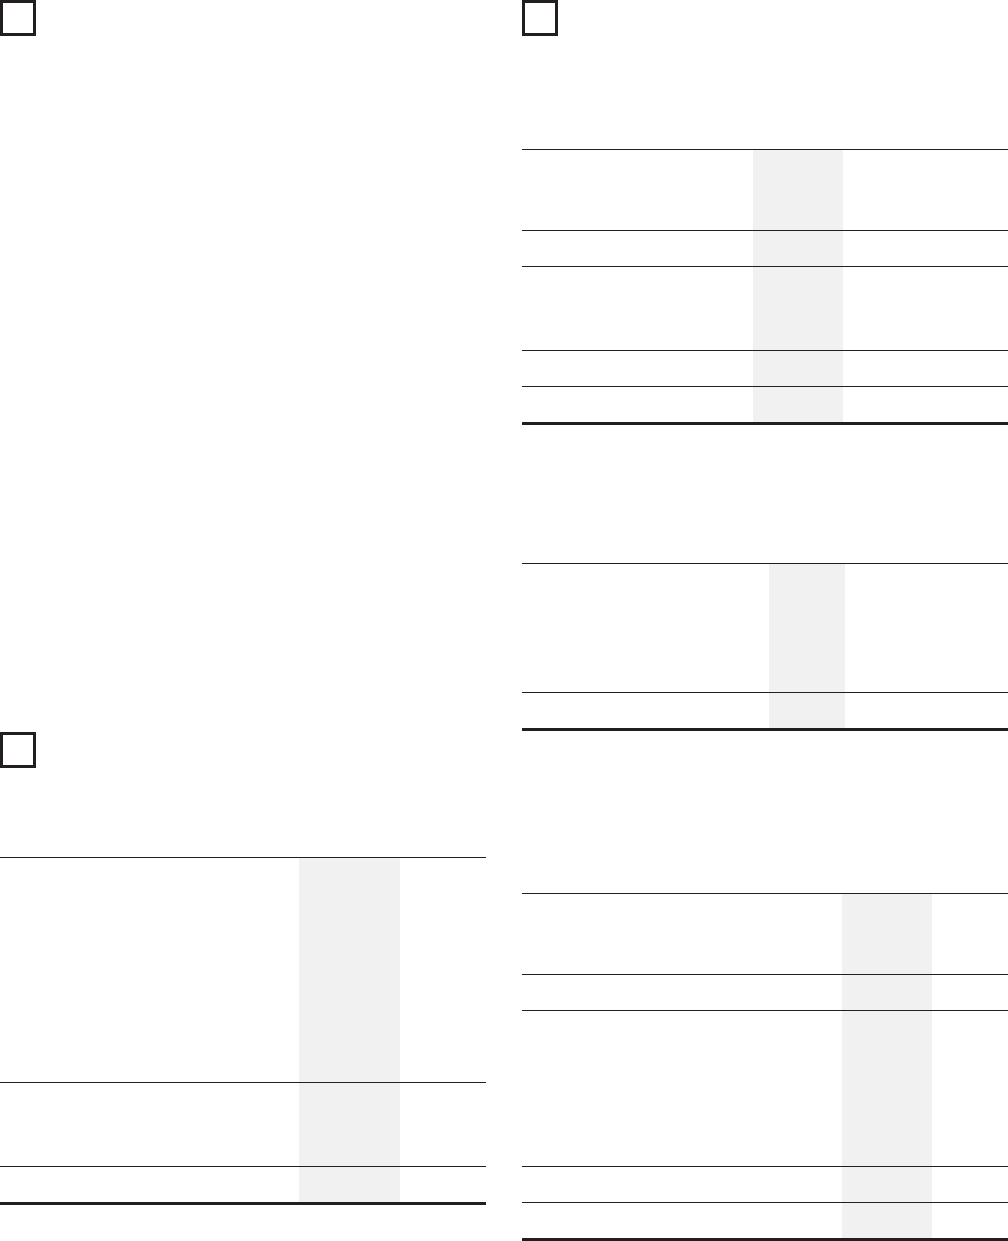
PROPERTY AND EQUIPMENT
Property and equipment, at cost, is summarized as follows:
As of February 29 or 28
(In thousands)
2004 2003
Buildings (25 to 40 years) $30,985 $ 18,381
Land 25,716 19,418
Land held for sale 3,163 3,354
Land held for development 3,580 8,021
Construction in progress 116,639 91,938
Furniture, fixtures, and equipment
(5 to 15 years) 103,787 86,129
Leasehold improvements
(8 to 15 years) 29,427 21,029
313,297 248,270
Less accumulated depreciation
and amortization 69,233 61,112
Property and equipment, net $244,064 $187,158
Land held for development represents land owned for
future sites that are scheduled to open more than one year
beyond the fiscal year reported.
6
5
INCOME TAXES
The components of the provision for income taxes on net
earnings were as follows:
Years Ended February 29 or 28
(In thousands)
2004 2003 2002
Current:
Federal $65,212 $47,600 $47,389
State 8,986 5,415 5,103
Total 74,198 53,015 52,492
Deferred:
Federal (1,180) 8,614 3,067
State (118) 266 95
Total (1,298) 8,880 3,162
Provision for income taxes $72,900 $61,895 $55,654
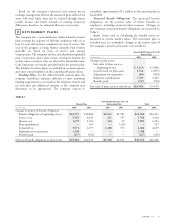
The effective income tax rate differed from the federal
statutory income tax rate as follows:
Years Ended February 29 or 28
2004 2003 2002
Federal statutory
income tax rate 35.0% 35.0% 35.0%
State and local income taxes,
net of federal benefit 3.1 3.0 2.9
Non-deductible items 0.4 1.5 0.1
Effective income tax rate 38.5% 39.5% 38.0%
The tax effects of temporary differences that give rise to a
significant portion of the deferred tax assets and liabilities
were as follows:
As of February 29 or 28
(In thousands)
2004 2003
Deferred tax assets:
Accrued expenses $9,048 $ 7,220
Other 79 120
Total gross deferred tax assets 9,127 7,340
Deferred tax liabilities:
Depreciation and amortization 5,224 5,748
Securitized receivables 27,940 29,138
Inventory 7,607 5,447
Prepaid expenses 882 831
Total gross deferred tax liabilities 41,653 41,164
Net deferred tax liability $32,526 $33,824
7