CarMax 2004 Annual Report Download - page 17
Download and view the complete annual report
Please find page 17 of the 2004 CarMax annual report below. You can navigate through the pages in the report by either clicking on the pages listed below, or by using the keyword search tool below to find specific information within the annual report.-
 1
1 -
2
-
3
-
4
-
5
-
6
-
 7
7 -
 8
8 -
 9
9 -
 10
10 -
 11
11 -
 12
12 -
 13
13 -
 14
14 -
 15
15 -
 16
16 -
 17
17 -
 18
18 -
 19
19 -
 20
20 -
 21
21 -
 22
22 -
 23
23 -
 24
24 -
 25
25 -
 26
26 -
 27
27 -
28
-
29
-
30
-
31
-
32
-
33
-
34
-
35
-
36
-
37
-
38
-
39
-
40
-
41
-
42
-
43
-
44
-
45
-
46
-
47
-
48
-
49
-
50
-
51
-
52
 |
 |
CARMAX 2004
15
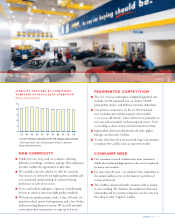
■We estimate we have an 8%–10% market share of late
model, 1- to 6-year-old used cars within the trade areas
of our most mature stores. This benchmark implies
a $20 billion to $25 billion sales potential in today’s
dollars as our stores reach maturity and we achieve full
national scope.
■Our market share is significantly higher within a 5-to-
10-mile radius. We are adding satellite stores in older mid-
sized markets to determine optimal storing density, best
storing patterns, and incremental market share
opportunities.
DEFENSIBLE COMPETITIVE
ADVANTAGE
■There have been numerous unsuccessful attempts to
replicate the CarMax model. At present, however, we are
fortunate to have no similar-format challengers. This
advantageous competitive landscape is allowing us to
expand on our own timetable, following our own
strategic priorities.
■CarMax has more than a 10-year development advantage
over any challenger who attempts to copy our business.
Building an organization, developing specialized
processes and systems, refining execution…all take time.
■CarMax intends to stay ahead of any potential
competition through relentless attention to people,
processes, and execution.
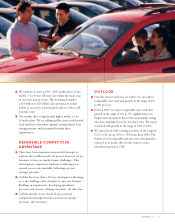
OUTLOOK
■Over the next several years, we believe we can achieve
comparable store used unit growth in the range of 4%
to 8% per year.
■In fiscal 2005, we expect comparable store used unit
growth in the range of 3% to 7%, slightly below our
longer-term expectation due to the exceptionally strong
sales base established over the last three years. We expect
total used unit growth in the range of 18% to 22%.
■We expect fiscal 2005 earnings per share in the range of
$1.21 to $1.26, up 10% to 15% from fiscal 2004. The
benefit of our comparable and new store sales growth is
expected to be partly offset by the return to more
normalized spreads at CAF.