CarMax 2004 Annual Report Download - page 21
Download and view the complete annual report
Please find page 21 of the 2004 CarMax annual report below. You can navigate through the pages in the report by either clicking on the pages listed below, or by using the keyword search tool below to find specific information within the annual report.-
 1
1 -
2
-
3
-
4
-
5
-
6
-
7
-
8
-
9
-
10
-
 11
11 -
 12
12 -
 13
13 -
 14
14 -
 15
15 -
 16
16 -
 17
17 -
 18
18 -
 19
19 -
 20
20 -
 21
21 -
 22
22 -
 23
23 -
 24
24 -
 25
25 -
 26
26 -
 27
27 -
 28
28 -
 29
29 -
 30
30 -
 31
31 -
32
-
33
-
34
-
35
-
36
-
37
-
38
-
39
-
40
-
41
-
42
-
43
-
44
-
45
-
46
-
47
-
48
-
49
-
50
-
51
-
52
 |
 |

CARMAX
2004 19
recognize commission revenue on extended warranties at the
time of the sale, net of a provision for estimated warranty
returns. The reserve for returns is based on historical
experience and trends.
Income Taxes
Estimates and judgments are used in the calculation of certain
tax liabilities and in the determination of the recoverability of
certain deferred tax assets. In the ordinary course of business,
many transactions occur for which the ultimate tax outcome is
uncertain at the time of the transactions. We adjust our income
tax provision in the period in which we determine that it is
probable that our actual results will differ from our estimates.
Tax law and rate changes are reflected in the income tax
provision in the period in which such changes are enacted.
We evaluate the need to record valuation allowances that
would reduce deferred tax assets to the amount that will more
likely than not be realized. When assessing the need for
valuation allowances, we consider future reversals of existing
temporary differences and future taxable income. As of
February 29, 2004, we believe that all of our recorded deferred
tax assets will more likely than not be realized. However, if a
change in circumstances results in a change in our ability to
realize our deferred tax assets, our tax provision would increase
in the period when the change of circumstances occurs.
In addition, the calculation of our tax liabilities involves
dealing with uncertainties in the application of complex tax
regulations. We recognize potential liabilities for anticipated tax
audit issues in the U.S. and other tax jurisdictions based on our
estimate of whether, and the extent to which, additional taxes
will be due. If payments of these amounts ultimately prove to be
unnecessary, the reversal of the liabilities would result in tax
benefits being recognized in the period when we determine the
liabilities are no longer necessary. If our estimate of tax liabilities
proves to be less than the ultimate assessment, a further charge
to expense would result in the period of determination.
Defined Benefit Retirement Plan
The plan obligations and related assets of our defined benefit
retirement plan are presented in Note 8 to the company’s
consolidated financial statements. Plan assets, which consist
primarily of marketable equity and debt instruments, are valued
using market quotations. Plan obligations and the annual
pension expense are determined by independent actuaries using
a number of assumptions provided by the company. Key
assumptions used to measure the plan obligations include the
discount rate, the rate of salary increases, and the estimated
future return on plan assets. In determining the discount rate,
we use the current yield on high-quality, fixed-income
investments that have maturities corresponding to the
anticipated timing of the benefit payments. Salary increase
assumptions are based upon historical experience and
anticipated future board and management actions. Asset returns
are estimated based upon the anticipated average yield on the
plan assets. We do not believe that any significant changes in
assumptions used to measure the plan obligations are likely to
occur that would have a material impact on the company’s
financial position or results of operations.
Insurance Liabilities
We use a combination of insurance and self-insurance for a
number of risks including workers’ compensation, general
liability, and employee-related health care benefits, a portion of
which is paid by our associates. We estimate the liabilities
associated with these risks by considering historical claims
experience, demographic factors, and other actuarial
assumptions. The estimated liabilities could be affected if future
occurrences and claims differ from the current assumptions and
historical trends. We do not believe that any significant changes
in assumptions used to estimate insurance liabilities are likely to
occur that would have a material impact on the company’s
financial position or results of operations.
RESULTS OF OPERATIONS
Certain prior year amounts have been reclassified to conform to
the current year’s presentation.
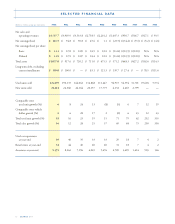
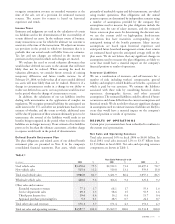
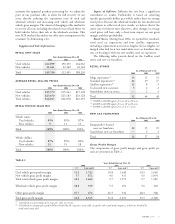
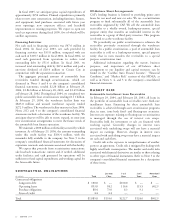
Net Sales and Operating Revenues
Total sales increased 16% in fiscal 2004 to $4.60 billion. In
fiscal 2003, total sales increased 12% to $3.97 billion from
$3.53 billion in fiscal 2002. Net sales and operating revenues
components are shown in Table 1.
TABLE 1
Years Ended February 29 or 28
(In millions)
2004 % 2003 % 2002 %
Used vehicle sales $3,470.6 75.5 $2,912.1 73.4 $2,497.2 70.7
New vehicle sales 515.4 11.2 519.8 13.1 559.9 15.8
Total retail vehicle sales 3,986.0 86.7 3,431.9 86.4 3,057.1 86.5
Wholesale vehicle sales 440.6 9.6 366.6 9.2 325.6 9.2
Other sales and revenues:
Extended warranty revenues 77.1 1.7 68.1 1.7 55.3 1.6
Service department sales 69.1 1.5 58.6 1.5 55.9 1.6
Third-party finance fees 19.6 0.4 16.2 0.4 15.7 0.4
Appraisal purchase processing fees 5.3 0.1 28.5 0.7 24.2 0.7
Total other sales and revenues 171.1 3.7 171.4 4.3 151.1 4.3
Total net sales and operating revenues $4,597.7 100.0 $3,969.9 100.0 $3,533.8 100.0