CarMax 2004 Annual Report Download - page 27
Download and view the complete annual report
Please find page 27 of the 2004 CarMax annual report below. You can navigate through the pages in the report by either clicking on the pages listed below, or by using the keyword search tool below to find specific information within the annual report.-
 1
1 -
2
-
3
-
4
-
5
-
6
-
7
-
8
-
9
-
10
-
11
-
12
-
13
-
14
-
15
-
16
-
 17
17 -
 18
18 -
 19
19 -
 20
20 -
 21
21 -
 22
22 -
 23
23 -
 24
24 -
 25
25 -
 26
26 -
 27
27 -
 28
28 -
 29
29 -
 30
30 -
 31
31 -
 32
32 -
 33
33 -
 34
34 -
 35
35 -
 36
36 -
 37
37 -
38
-
39
-
40
-
41
-
42
-
43
-
44
-
45
-
46
-
47
-
48
-
49
-
50
-
51
-
52
 |
 |
CARMAX
2004 25
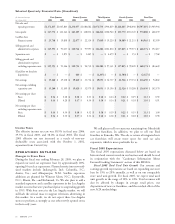
Fiscal 2005 Comparable Store Used Unit Growth. We
expect fiscal 2005 comparable store used unit growth in the
range of 3% to 7%. Fiscal 2005 comparable store growth is
still challenged, we believe, by the exceptionally strong sales
base we established over the past three years, especially
following the high levels of customer traffic stimulated by the
widespread introduction of 0% financing after the events of
September 11, 2001.
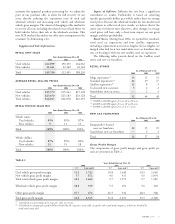
Fiscal 2005 Earnings Per Share. We expect fiscal 2005
pretax earnings growth of 12% to 17%. We anticipate that our
effective tax rate will increase from 38.5% to 39.0% as we
expand our store base into states with higher tax rates.
Consequently our earnings per share growth will be slightly
lower at 10% to 15%, in the range of $1.21 to $1.26.
We expect our gross margin to be favorably impacted by the
growing mix of used car sales, as we add used car superstores
and divest new car franchises. In addition, we believe a
refinement of our ACR methodology will provide an
incremental benefit to gross margin.
In fiscal 2005, we expect CAF’s gain as a percent of loans
sold to be slightly below the midpoint of our 3.5% to 4.5%
normalized range. Therefore, we expect CAF income will be
relatively flat with fiscal 2004, despite the anticipated increase
in loan volume. Our fiscal 2005 pretax earnings growth would
be expected in the range of 19% to 24% if our CAF spread
remained at the 4.7% that it was in fiscal 2004.
In fiscal 2005, we will still be experiencing the growth
penalty of opening new stores, which have higher SG&A rates,
while none of our newer stores will have reached mature levels
of revenue. We believe our corporate overhead expenditures as
a percent of sales will remain flat compared with fiscal 2004,
even though we expect to absorb approximately $4 million in
additional expenses related to being a stand-alone company.
Among these expenses are costs related to outsourcing our
payroll systems, which previously had been supplied by Circuit
City. We also expect another $3 million to $5 million of
incremental stand-alone costs in fiscal 2006 when we outsource
our data center, which is now housed at Circuit City. This
should be the last major incremental stand-alone cost increase
we will incur.
Longer-Term Expectations
The longer-term expectations discussed below are based on
historical and current trends in our business and should be read
in conjunction with the “Cautionary Information About
Forward-Looking Statements” section of this MD&A.
We expect used unit comparable store sales increases in the
range of 4% to 8% over the next several years, reflecting the
multi-year ramp in sales of newly opened stores as they mature.
Once CAF income reflects comparative spreads in our
normalized range, we expect the combination of unit growth
and expense leverage to deliver average annual earnings per
share growth of approximately 20%.
RECENT ACCOUNTING
PRONOUNCEMENTS
For a discussion of recent accounting pronouncements
applicable to the company, see Note 14 to the company’s
consolidated financial statements.
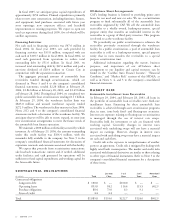
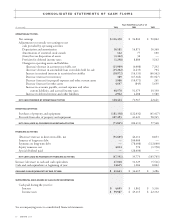
FINANCIAL CONDITION
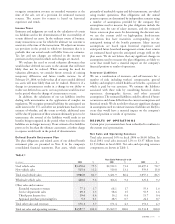
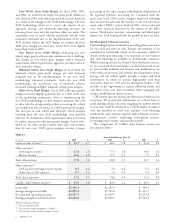
Operating Activities
We generated net cash from operating activities of $148.5
million in fiscal 2004, $72.0 million in fiscal 2003, and $42.6
million in fiscal 2002. The fiscal 2004 improvement primarily
resulted from the increase in net earnings and a slight decrease
in inventory, despite adding nine used car superstores during
the year. The decrease in inventory in fiscal 2004 reflects the
combined effects of a higher-than-normal inventory balance at
the end of fiscal 2003 resulting from weather-impeded sales in
February 2003 and the disposal of four new car franchises
during the current fiscal year. The fiscal 2003 improvement
primarily resulted from an increase in net earnings and an
increase in accounts payable and accrued expenses associated
with the separation from Circuit City. Prior to fiscal 2003,
certain liabilities such as the workers’ compensation liability
were recorded through the debt from our former parent and
therefore reflected as financing activities.
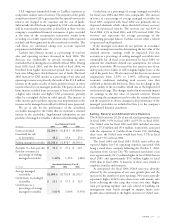
Investing Activities
Net cash used in investing activities was $73.8 million in fiscal
2004 and $80.4 million in fiscal 2003. Net cash provided by
investing activities was $57.5 million in fiscal 2002. Capital
expenditures were $181.3 million in fiscal 2004, $122.0
million in fiscal 2003, and $41.4 million in fiscal 2002. The
increase in capital expenditures reflects the increase in our store
base associated with the resumption of our growth plan.
Additionally, some of the fiscal 2004 increase is associated with
the initial expenditures associated with our future corporate
office site in Richmond, Va.
Capital expenditures are funded through sale-leaseback
transactions, short- and long-term debt, and internally
generated funds. Net proceeds from sales of property and
equipment totaled $107.5 million in fiscal 2004, $41.6 million
in fiscal 2003, and $99.0 million in fiscal 2002. The majority
of the sale proceeds relate to sale-leaseback transactions. In
fiscal 2004, the company entered into sale-leaseback
transactions involving nine properties valued at approximately
$107.0 million. In fiscal 2003, we entered into a sale leaseback
transaction involving three superstore properties valued at
approximately $37.6 million and in fiscal 2002 we entered into
a sale leaseback transaction involving nine superstore properties
valued at approximately $102.4 million. These transactions
were structured as operating leases with initial terms of either
15 or 20 years with various renewal options. At February 29,
2004, we owned a total of four CarMax superstores.