CarMax 2004 Annual Report Download - page 2
Download and view the complete annual report
Please find page 2 of the 2004 CarMax annual report below. You can navigate through the pages in the report by either clicking on the pages listed below, or by using the keyword search tool below to find specific information within the annual report.-
 1
1 -
 2
2 -
 3
3 -
 4
4 -
 5
5 -
 6
6 -
 7
7 -
 8
8 -
 9
9 -
 10
10 -
 11
11 -
 12
12 -
 13
13 -
14
-
15
-
16
-
17
-
18
-
19
-
20
-
21
-
22
-
23
-
24
-
25
-
26
-
27
-
28
-
29
-
30
-
31
-
32
-
33
-
34
-
35
-
36
-
37
-
38
-
39
-
40
-
41
-
42
-
43
-
44
-
45
-
46
-
47
-
48
-
49
-
50
-
51
-
52
 |
 |
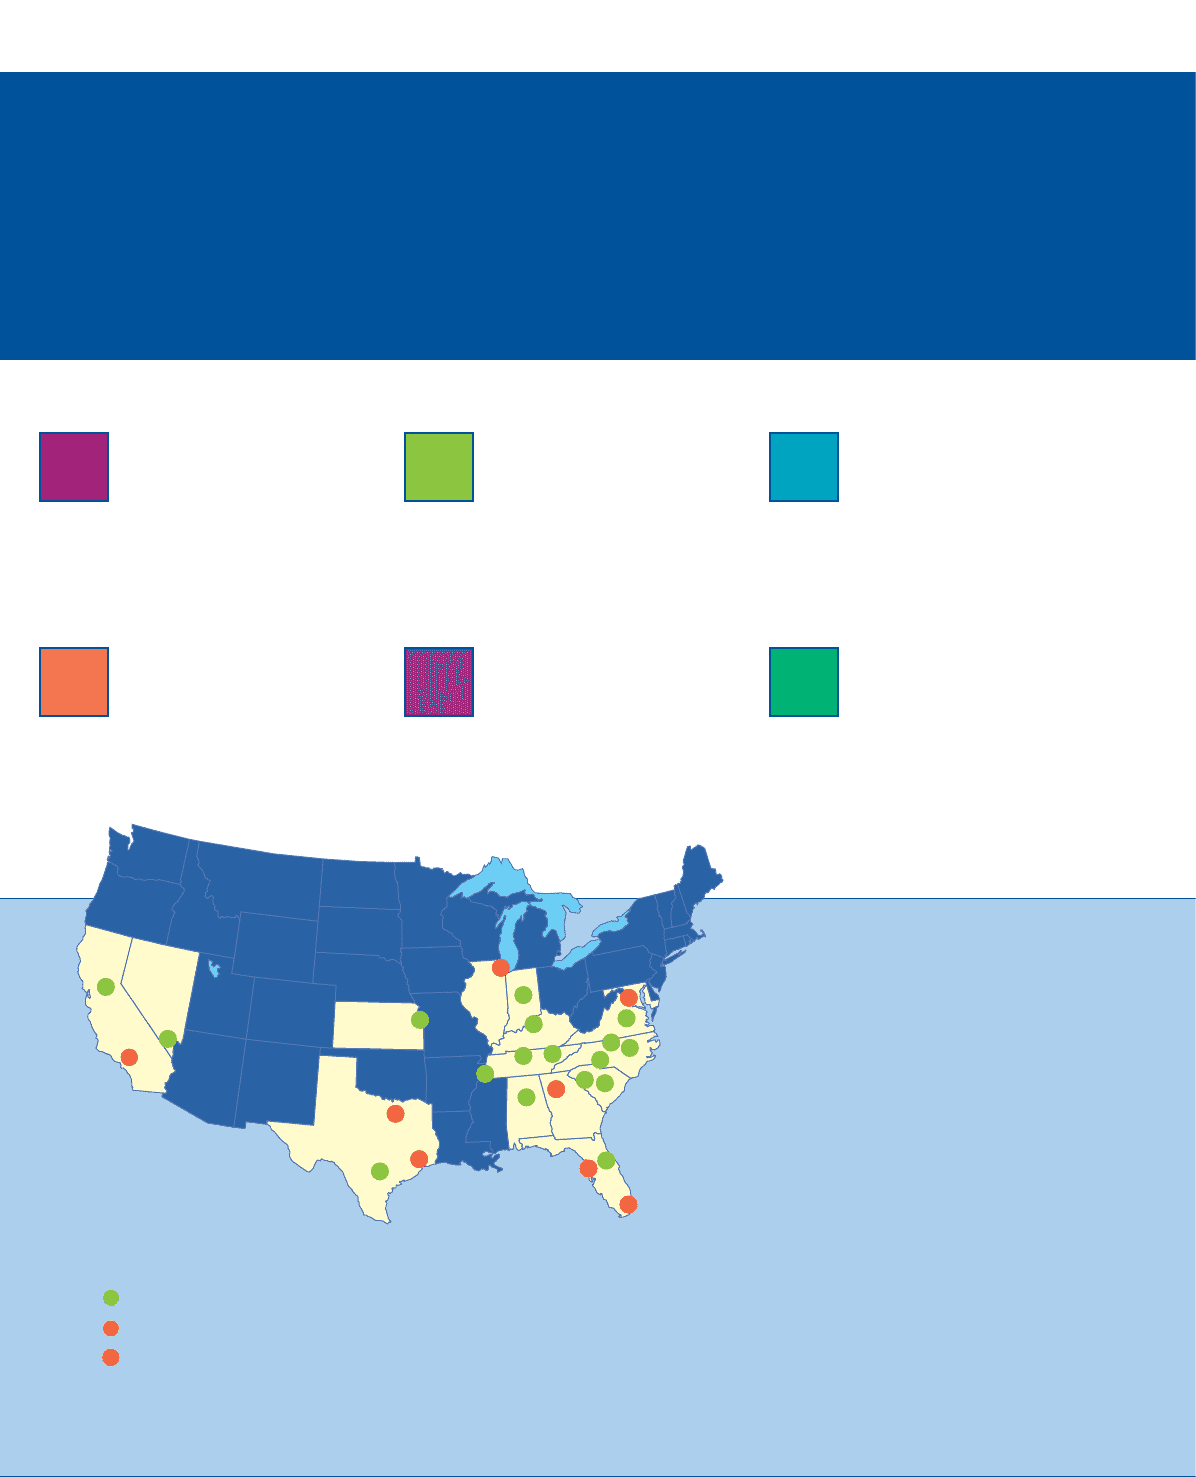
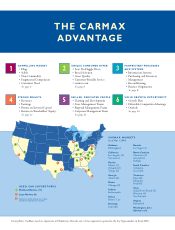
CARMAX MARKETS
(as of May 1, 2004)
Alabama
Birmingham
California
Los Angeles (2)
Sacramento
Florida
Miami (3)
Orlando (2)
Tampa (2)
Georgia
Atlanta (4)
Illinois
Chicago (8)
Indiana
Indianapolis
Kansas
Kansas City
Kentucky
Louisville
Nevada
Las Vegas (2)
North Carolina
Charlotte (2)
Greensboro
Raleigh
South Carolina
Columbia
Greenville
Tennessee
Knoxville
Memphis
Nashville
Texas
Dallas/Fort Worth (4)
Houston (4)
San Antonio
Virginia
Richmond
Washington, D.C./
Baltimore (4)
1
2
2
1
Mid-Sized Markets (17)
Large Markets (8)
Numbers in circles indicate the number
of used car superstores in a market.
1
1
1
1
1
1
1
111
2
1
11
2
2
3
4
4
4
4
8
USED CAR SUPERSTORES
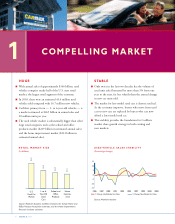
COMPELLING MARKET
•Huge
•Stable
•Non-Commodity
•Fragmented Competition
•Consumer Need
See page 4.
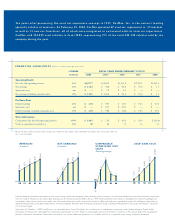
STRONG RESULTS
•Revenues
•Earnings
•Return on Invested Capital
•Return on Shareholders’ Equity
See page 11.
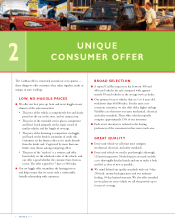
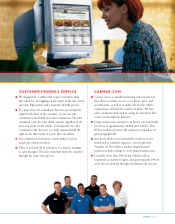
UNIQUE CONSUMER OFFER
•Low, No-Haggle Prices
•Broad Selection
•Great Quality
•Customer-Friendly Service
•carmax.com
See page 6.
SKILLED, DEDICATED PEOPLE
•Training and Development
•Store Management Teams
•Regional Management Teams
•Corporate Management Team
See page 12.
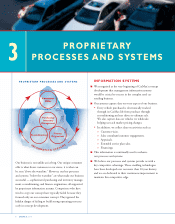
PROPRIETARY PROCESSES
AND SYSTEMS
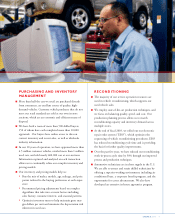
•Information Systems
•Purchasing and Inventory
Management
•Reconditioning
•Finance Originations
See page 8.
SOLID GROWTH OPPORTUNITY
•Growth Plan
•Defensible Competitive Advantage
•Outlook
See page 14.
12 3
456
THE CARMAX
ADVANTAGE
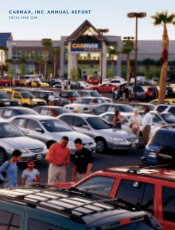
Cover photo: CarMax’s used car superstore in Henderson, Nevada, one of two superstores opened in the Las Vegas market in fiscal 2004.