CarMax 2004 Annual Report Download - page 23
Download and view the complete annual report
Please find page 23 of the 2004 CarMax annual report below. You can navigate through the pages in the report by either clicking on the pages listed below, or by using the keyword search tool below to find specific information within the annual report.-
 1
1 -
2
-
3
-
4
-
5
-
6
-
7
-
8
-
9
-
10
-
11
-
12
-
 13
13 -
 14
14 -
 15
15 -
 16
16 -
 17
17 -
 18
18 -
 19
19 -
 20
20 -
 21
21 -
 22
22 -
 23
23 -
 24
24 -
 25
25 -
 26
26 -
 27
27 -
 28
28 -
 29
29 -
 30
30 -
 31
31 -
 32
32 -
 33
33 -
34
-
35
-
36
-
37
-
38
-
39
-
40
-
41
-
42
-
43
-
44
-
45
-
46
-
47
-
48
-
49
-
50
-
51
-
52
 |
 |

CARMAX
2004 21
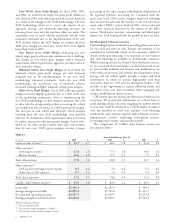
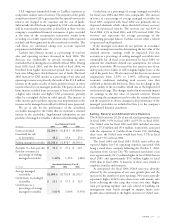
TABLE 2
Years Ended February 29 or 28
2004 2003 2002
%
(1)
$ per unit
(2)
%
(1)
$ per unit
(2)
%
(1)
$ per unit
(2)
Used vehicle gross profit margin 11.3 1,742 10.8 1,648 10.9 1,660
New vehicle gross profit margin 3.7 872 4.0 931 4.5 1,054
Total retail vehicle gross profit margin 10.3 1,666 9.7 1,572 9.7 1,583
Wholesale vehicle gross profit margin 10.4 359 5.5 192 5.6 202
Other gross profit margin 67.7 472 66.5 534 68.3 548
Total gross profit margin 12.4 2,323 11.8 2,201 11.9 2,228
(1) Calculated as a percentage of its respective sales or revenue.
(2) Calculated as category gross profit dollars divided by the respective units sold, except the other and total categories, which are divided by
total retail units sold.
customer the appraisal purchase processing fee, we adjust the
price of our purchase offer to allow for full recovery of our
costs, thereby reducing the acquisition costs of used and
wholesale vehicles and increasing used vehicle and wholesale
vehicle gross margins. The intent of changing to this method is
to recover all costs, including the related costs of land where we
hold vehicles before their sale at the wholesale auctions. This
new ACR method also makes our offer more transparent to the
consumer by eliminating a fee.
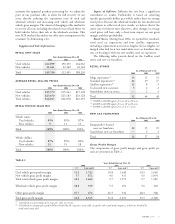
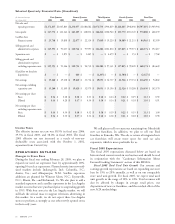
Supplemental Sales Information.
RETAIL UNIT SALES
Years Ended February 29 or 28
2004 2003 2002
Used vehicles 224,099 190,135 164,062
New vehicles 21,641 22,360 24,164
Total 245,740 212,495 188,226
AVERAGE RETAIL SELLING PRICES
Years Ended February 29 or 28
2004 2003 2002
Used vehicles $15,379 $15,243 $15,128
New vehicles $23,650 $23,183 $23,128
Total vehicles $16,107 $16,078 $16,155
RETAIL VEHICLE SALES MIX
Years Ended February 29 or 28
2004 2003 2002
Vehicle units:
Used vehicles 91% 89% 87%
New vehicles 911 13
Total 100% 100% 100%
Vehicle dollars:
Used vehicles 87% 85% 82%
New vehicles 13 15 18
Total 100% 100% 100%
Impact of Inflation. Inflation has not been a significant
contributor to results. Profitability is based on achieving
specific gross profit dollars per vehicle rather than on average
retail prices. Because the wholesale market for late-model used
cars adjusts to reflect retail price trends, we believe that if the
stores meet inventory turn objectives, then changes in average
retail prices will have only a short-term impact on our gross
margin and thus profitability.
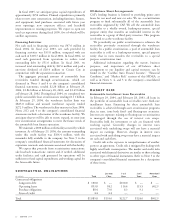
Retail Stores. During fiscal 2004, we opened five standard-
sized used car superstores and four satellite superstores,
including a replacement store in Los Angeles. In Los Angeles, we
merged what had been two stand-alone new car franchises into
one, co-locating it with our new satellite used car superstore.
The following tables provide detail on the CarMax retail
stores and new car franchises:
RETAIL STORES
As of February 29 or 28
2004 2003 2002
Mega superstores(1) 13 13 13
Standard superstores(2) 24 19 17
Satellite superstores(3) 12 85
Co-located new car stores 322
Stand-alone new car stores —23
Total 52 44 40
(1) 70,000 to 95,000 square feet on 20 to 35 acres.
(2) 40,000 to 60,000 square feet on 10 to 25 acres.
(3) 10,000 to 20,000 square feet on 4 to 7 acres.
NEW CAR FRANCHISES
As of February 29 or 28
2004 2003 2002
Integrated/co-located
new car franchises 12 15 15
Stand-alone new car franchises —23
Total 12 17 18
Gross Profit Margin
The components of gross profit margin and gross profit per
unit are presented in Table 2.