CarMax 2004 Annual Report Download - page 18
Download and view the complete annual report
Please find page 18 of the 2004 CarMax annual report below. You can navigate through the pages in the report by either clicking on the pages listed below, or by using the keyword search tool below to find specific information within the annual report.-
 1
1 -
2
-
3
-
4
-
5
-
6
-
7
-
 8
8 -
 9
9 -
 10
10 -
 11
11 -
 12
12 -
 13
13 -
 14
14 -
 15
15 -
 16
16 -
 17
17 -
 18
18 -
 19
19 -
 20
20 -
 21
21 -
 22
22 -
 23
23 -
 24
24 -
 25
25 -
 26
26 -
 27
27 -
 28
28 -
29
-
30
-
31
-
32
-
33
-
34
-
35
-
36
-
37
-
38
-
39
-
40
-
41
-
42
-
43
-
44
-
45
-
46
-
47
-
48
-
49
-
50
-
51
-
52
 |
 |

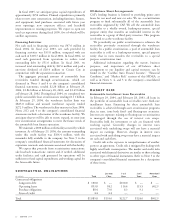
16
CARMAX 2004
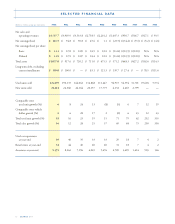
(Dollars in millions except per share data)
FY04 FY03 FY02 FY01 FY00 FY99 FY98 FY97 FY96 FY95
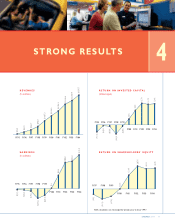
Net sales and
operating revenues $4,597.7 $3,969.9 $3,533.8 $2,758.5 $2,201.2 $1,607.3 $950.7 $566.7 $327.1 $ 93.5
Net earnings (loss) $ 116.5 $ 94.8 $ 90.8 $ 45.6 $ 1.1 $ (23.5) $ (34.2) $ (9.3) $ (5.2) $ (4.1)
Net earnings (loss) per share:
Basic $ 1.13 $ 0.92 $ 0.89 $ 0.45 $ 0.01 $ (0.24) $ (0.35) $ (0.10) N/A N/A
Diluted $ 1.10 $ 0.91 $ 0.87 $ 0.44 $ 0.01 $ (0.24) $ (0.35) $ (0.10) N/A N/A
Total assets $1,037.0 $ 917.6 $ 720.2 $ 711.0 $ 675.5 $ 571.2 $448.3 $427.2 $102.6 $114.3
Long-term debt, excluding
current installments $ 100.0 $ 100.0 $ — $ 83.1 $ 121.3 $ 139.7 $ 27.4 $ — $ 78.5 $111.6
Used units sold 224,099 190,135 164,062 132,868 111,247 96,915 56,594 31,701 19,618 5,574
New units sold 21,641 22,360 24,164 20,157 17,775 6,152 4,265 2,799 — —
Comparable store
used unit growth (%) 68 24 13 (8) (5) 6 7 12 19
Comparable store vehicle
dollar growth (%) 66 28 17 2 (2) 6231243
Total used unit growth (%) 18 16 23 19 15 71 79 62 252 335
Total sales growth (%) 16 12 28 25 37 69 68 73 250 356
Used car superstores
at year-end 49 40 35 33 33 29 18 7 4 2
Retail stores at year-end 52 44 40 40 40 31 18 7 4 2
Associates at year-end 9,355 8,263 7,196 6,065 5,676 4,789 3,605 1,614 903 146
SELECTED FINANCIAL DATA