CarMax 2004 Annual Report Download - page 13
Download and view the complete annual report
Please find page 13 of the 2004 CarMax annual report below. You can navigate through the pages in the report by either clicking on the pages listed below, or by using the keyword search tool below to find specific information within the annual report.-
 1
1 -
2
-
 3
3 -
 4
4 -
 5
5 -
 6
6 -
 7
7 -
 8
8 -
 9
9 -
 10
10 -
 11
11 -
 12
12 -
 13
13 -
 14
14 -
 15
15 -
 16
16 -
 17
17 -
 18
18 -
 19
19 -
 20
20 -
 21
21 -
 22
22 -
 23
23 -
24
-
25
-
26
-
27
-
28
-
29
-
30
-
31
-
32
-
33
-
34
-
35
-
36
-
37
-
38
-
39
-
40
-
41
-
42
-
43
-
44
-
45
-
46
-
47
-
48
-
49
-
50
-
51
-
52
 |
 |
CARMAX 2004
11
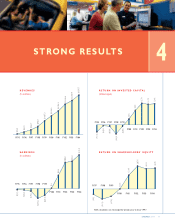
4
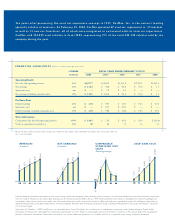
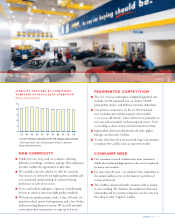
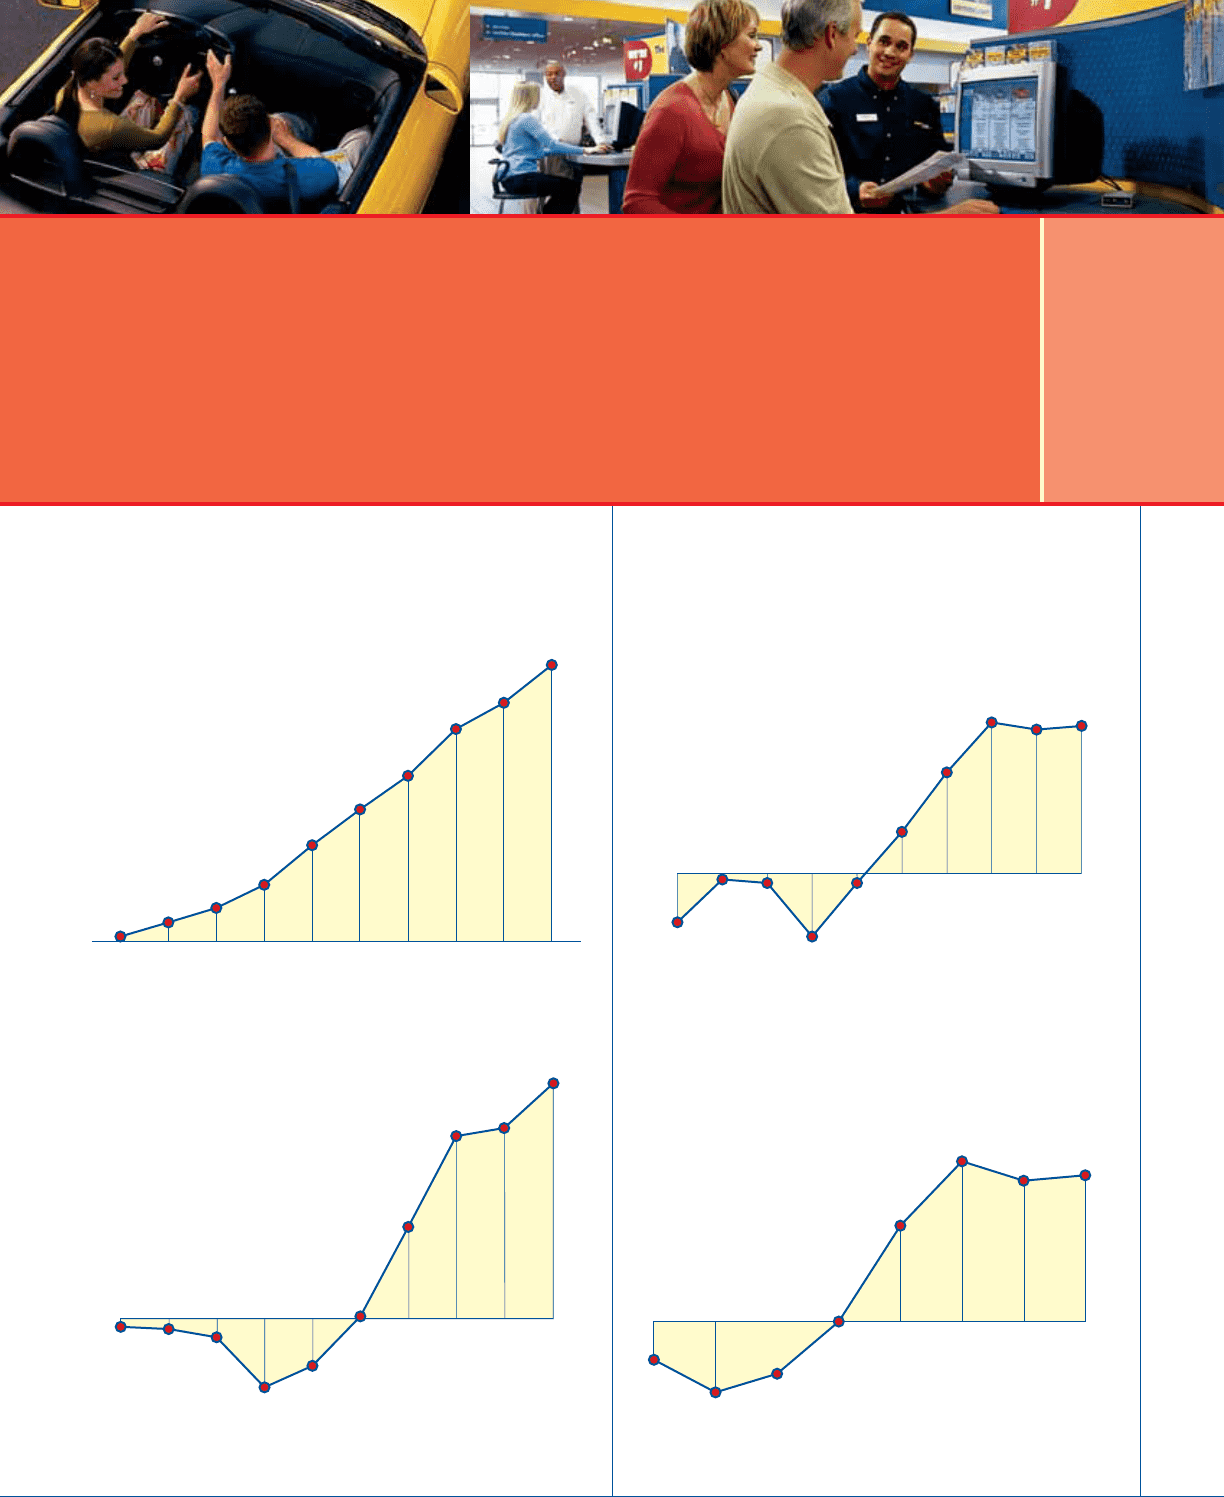
STRONG RESULTS
$(4.1)
$(5.2)
$(9.3)
$(34.2)
$(23.5)
$1.1
$45.6
$90.8
$94.8
$116.5
FY04FY03FY02FY01
FY00
FY99FY98FY97FY96FY95
$93.5
$327.1
$566.7
$950.7
$1,607.3
$2,201.2
$2,758.5
$3,533.8
$3,969.9
$4,597.7
FY04FY03FY02FY01FY00FY99FY98FY97FY96FY95
REVENUES
(In millions)
RETURN ON INVESTED CAPITAL
(Unleveraged)
EARNINGS
(In millions)
RETURN ON SHAREHOLDERS’ EQUITY
FY04FY03
FY02
FY01FY00
FY99FY98FY97
18.9%
18.2%
20.7%
12.4%
0.3%
(6.7%)
(9.1%)
(5%)
(4.1%)
(0.5)%
(0.8)%
(5.3)%
(0.8)%
3.5%
8.5%
12.7%
12.1%
12.4%
FY04FY03FY02FY01FY00
FY99FY98FY97FY96FY95
ROE calculations not meaningful for periods prior to fiscal 1997.