CarMax 2004 Annual Report Download - page 3
Download and view the complete annual report
Please find page 3 of the 2004 CarMax annual report below. You can navigate through the pages in the report by either clicking on the pages listed below, or by using the keyword search tool below to find specific information within the annual report.-
 1
1 -
 2
2 -
 3
3 -
 4
4 -
 5
5 -
 6
6 -
 7
7 -
 8
8 -
 9
9 -
 10
10 -
 11
11 -
 12
12 -
 13
13 -
 14
14 -
15
-
16
-
17
-
18
-
19
-
20
-
21
-
22
-
23
-
24
-
25
-
26
-
27
-
28
-
29
-
30
-
31
-
32
-
33
-
34
-
35
-
36
-
37
-
38
-
39
-
40
-
41
-
42
-
43
-
44
-
45
-
46
-
47
-
48
-
49
-
50
-
51
-
52
 |
 |
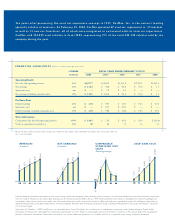
FINANCIAL HIGHLIGHTS
(Dollars in millions except per share data)
% CHANGE FISCAL YEARS ENDED FEBRUARY 29 OR 28
’03 TO ’04 2004 2003* 2002* 2001
2000
Operating Results
Net sales and operating revenues 16% $4,597.7 $3,969.9 $3,533.8 $2,758.5 $2,201.2
Net earnings 23% $ 116.5 $ 94.8 $ 90.8 $ 45.6 $ 1.1
Separation costs nm $— $ 7.8 $ 0.4 $ — $ —
Net earnings excluding separation costs 14% $ 116.5 $ 102.6 $ 91.2 $ 45.6 $ 1.1
Per Share Data
Diluted earnings 21% $ 1.10 $ 0.91 $ 0.87 $ 0.44 $ 0.01
Separation costs nm $— $ 0.07 $ 0.01 $ — $ —
Diluted earnings excluding separation costs 12% $ 1.10 $ 0.98 $ 0.88 $ 0.44 $ 0.01
Other Information
Cash provided by (used in) operating activities 106% $ 148.5 $ 72.0 $ 42.6 $ 18.0 $ (23.6)
Used car superstores at end of year 23% 49 40 35 33 33
Forward-Looking Statements: Statements in this annual report about the company’s future business plans, prospects, and financial performance are forward-looking statements
that are made in reliance on the safe harbor provisions of the Private Securities Reform Act of 1995. These statements are based on management’s current knowledge and
assumptions about future events and involve risks and uncertainties that could cause actual results to differ materially from anticipated results. For additional information on
important factors that could affect expectations, see the company’s Securities and Exchange Commission filings, including “Management’s Discussion and Analysis” contained
in this annual report.
Separation: On October 1, 2002, CarMax, Inc. was separated from Circuit City Stores, Inc. and became an independent, separately traded public company. Details of the
separation are discussed in “Management’s Discussion and Analysis” and the “Notes to Consolidated Financial Statements” contained in this annual report.The consolidated
financial statements and related information contained in this annual report are presented as if CarMax existed as a separate entity during all periods presented.
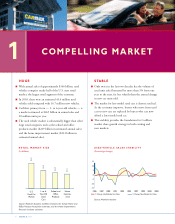
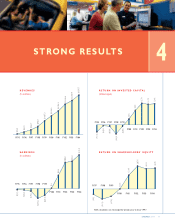
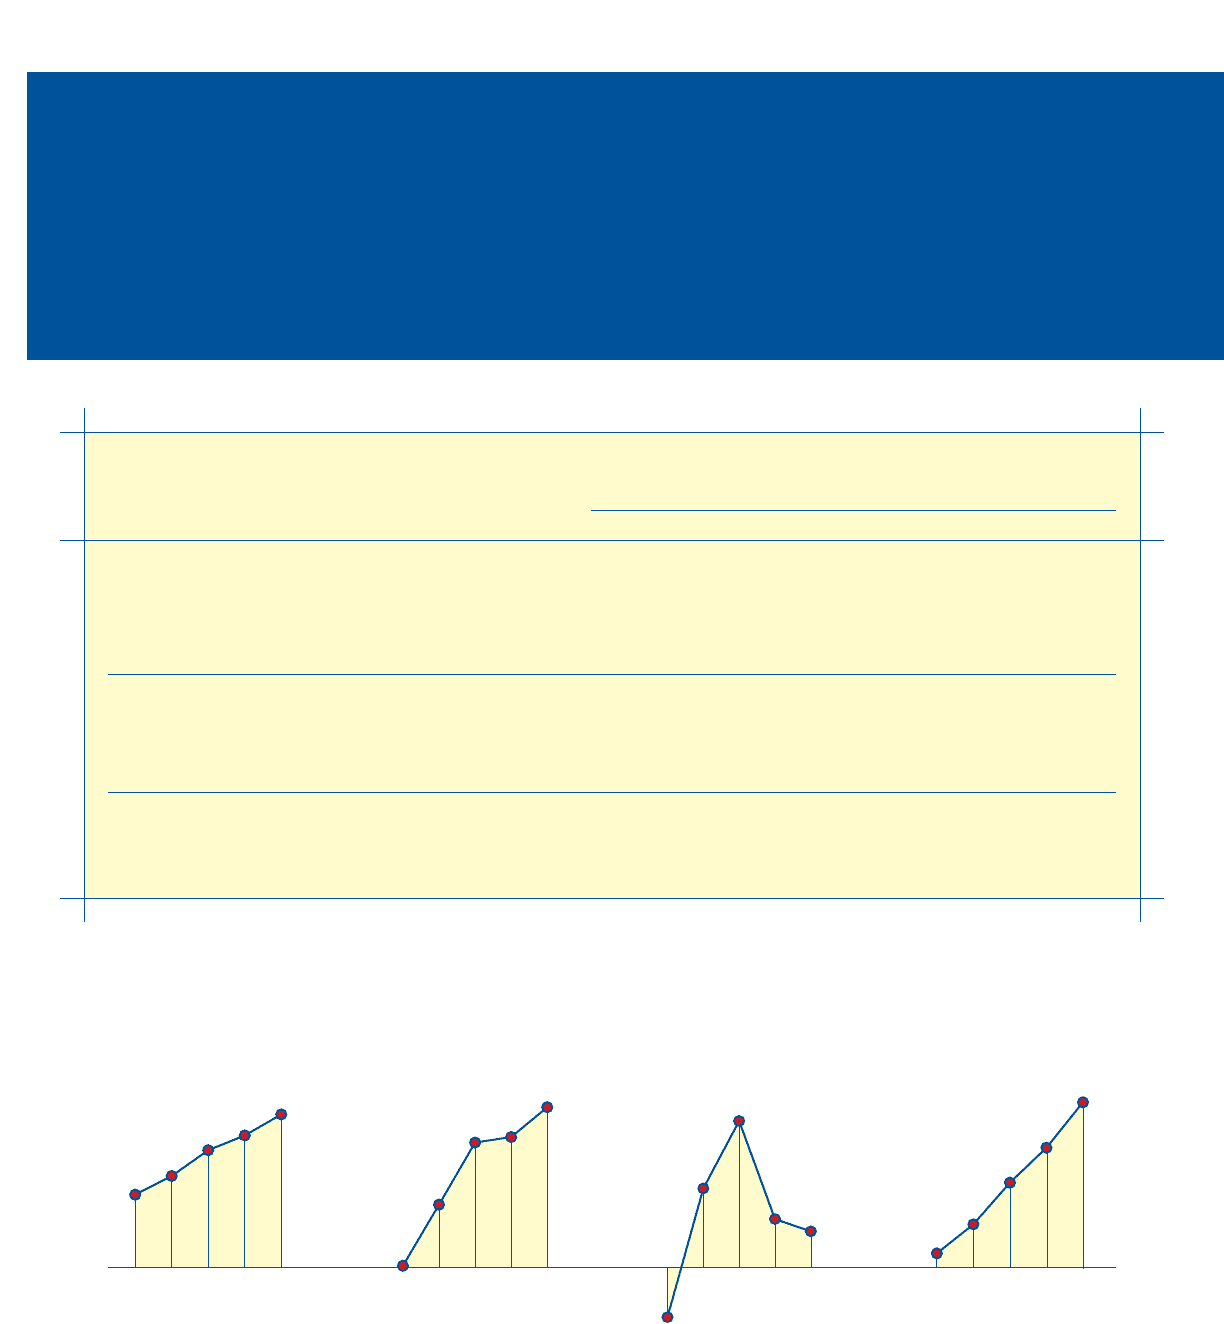
REVENUES
(In billions)
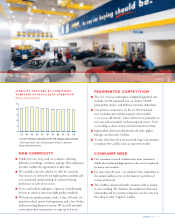
COMPARABLE
STORE USED UNIT
SALES
(Percentage change)
NET EARNINGS
(In millions)
USED CARS SOLD
01 02 03 0401 02 03 04 01 02 03 04
00
(8)
13
24
8
6
00
$2.20
$2.76
$3.53
$3.97
$4.60
00
$1.1
$45.6
$90.8
$94.8
$116.5
01 02 03 0400
224,099
111,247
132,868
164,062
190,135
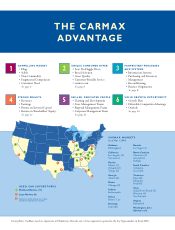
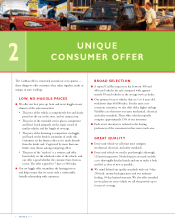
Ten years after pioneering the used car superstore concept in 1993, CarMax, Inc. is the nation’s leading
specialty retailer of used cars. At February 29, 2004, CarMax operated 49 used car superstores in 23 markets,
as well as 12 new car franchises, all of which were integrated or co-located with its used car superstores.
CarMax sold 224,099 used vehicles in fiscal 2004, representing 91% of the total 245,740 vehicles sold by the
company during the year.
* Results for fiscal 2003 and fiscal 2002 include costs related to the October 2002 separation of CarMax from Circuit City Stores, Inc.
nm = not meaningful